We’ve been hiding our bundles under a bushel! Find out more >>

800-899-6060

“The Top 10 Real Estate Finance Books Every Investor Should Read.”

investment book

I was honored to find that one of my books was featured at the top of a recent article on Motley Fool: “The Top 10 Real Estate Finance Books Every Investor Should Read.” The book, “What Every Real Estate Investor Needs to Know About Cash Flow,” was originally published in 2004, is now in its third edition, and is alive and still doing well —  a surprise certainly to me, and probably to the publisher as well.


I often get asked what accounts for the book’s long-term appeal, and I think there may be two reasons: First, I avoided “topical” or trendy content, preferring to stick with core concepts and math-based metrics don’t change with time. And second because I really dislike the get-rich quick hype that seems to characterize so many real estate books, and so I shunned that, too.

I don’t think they’ll ever make a movie out of it, but I’m satisfied if it has helped some readers make informed and unemotional investment decisions.

You can find the article here.


Are you involved in real estate education?

We’re reaching out to our followers who teach real estate investment, development, or finance to let you know that our Real Estate Investment Analysis course is available for the virtual classroom – now with volume academic pricing.

For more than a decade I’ve devoted much of my professional life to investor education, as a writer, Columbia adjunct professor, and through my company RealData. As you may know, a few years ago I created an online video course, Introduction to Real Estate Investment Analysis. It has grown to include a broad range of topics that are key to understanding how income-producing properties work, and how investors, developers, lenders, and others evaluate their financial dynamics.

With so many schools and colleges now needing to provide good content for a virtual learning environment, we’ve re-deployed the course as a resource that instructors can add to their existing curricula. We now offer volume academic pricing at a significant discount, depending on class size.

For an overview, including access to sample lessons, go to the course home page.  To see a complete course outline, click here.

If you’re involved in real estate or financial education, then I hope that this can help you provide meaningful content to your remote learners. To get a quote for volume licenses for student use or to discuss this further, please email me at education@realdata.com.

— Frank Gallinelli

####

Copyright 2020,  Frank Gallinelli and RealData® Inc. All Rights Reserved


The information presented in this article represents the opinions of the author and does not necessarily reflect the opinions of RealData® Inc. The material contained in articles that appear on realdata.com is not intended to provide legal, tax or other professional advice or to substitute for proper professional advice and/or due diligence. We urge you to consult an attorney, CPA or other appropriate professional before taking any action in regard to matters discussed in any article or posting. The posting of any article and of any link back to the author and/or the author’s company does not constitute an endorsement or recommendation of the author’s products or services.


What Kind of Real Estate Investment Makes Sense for YOU?

If you watch what’s happening with the stock market, you’re probably ready to reach for the Dramamine. It’s like being trapped in a really fast elevator, except the buttons don’t take you where you expect to go. Maybe somebody else is controlling the ride.

You realize that most of the people you see who have achieved genuine financial independence have done so with real estate. Your next step is to figure out how you can do the same.

But… real estate comes in a lot of flavors. There are some fundamental differences among the various types, and you need to understand those differences before you start your investing campaign. One size does not fit all. Let’s look at a few of your options.


REIT (Real Estate Investment Trust)

A REIT is fundamentally a stock investment, a lot like the ones you may have decided to put behind you.

If you buy stock in an oil company, you’re investing in a firm that probably owns and operates wells, refineries, and retail distribution.

If you buy stock in a REIT you’re investing in a company that owns and operates real estate, and probably deals with retail customers, aka tenants. Pretty much the same business model, different industry. The advantage here, as with other stocks, is liquidity. Buy today, sell tomorrow. But remember, it’s someone else’s company, and you’re a few layers away from actually investing in real estate.


Fix and Flip

This is a situation where you buy a property, fix it up, and sell it for a profit. The plan is for the ARV (After Repair Value) to be greater than the sum of the cost to buy plus the cost to repair. The single-family house is probably the most common fix-and-flip.

Sounds good, and plenty of people have made money doing this, but it’s far from the slam dunk you might see on reality TV. The first challenge is in finding a suitable property—one that you can buy on favorable terms, get financed, improve substantially at a reasonable cost, and sell quickly for a profit.

Where many flippers run off the rails is in underestimating their true costs. Besides the cost to buy and fix-up, you have to carry the property. This means loan payments, property taxes, insurance, and utilities during the fix-up period and also while you’re searching for a buyer. In addition, there may be costs of sale (commission and attorney), as well as taxes on the profit. In many circumstances, your profit might be taxed at ordinary income rates, not as capital gain.

All of these are considerations that a real estate developer might routinely take into account—and indeed, one could argue that a flip is essentially a type of development project—but the budding entrepreneur might not start out with so broad a perspective. And you might not have the infrastructure in place—e.g., access to capital and to contractors—that you need to achieve a suitable profit.


Single Family Houses as Rentals

Many first-time investors gravitate toward single-family houses as rental properties.

That choice may be driven more by personal comfort level than by the merits of this approach as an investment strategy. If you have been a residential tenant, then you probably know something about the roles and responsibilities of both tenant and landlord. Even if you don’t know the fine points of leasing and landlording, you understand the basic ground rules and this seems like familiar and comfortable territory.

These are benefits not to be taken lightly, but there are other considerations. Have you made a realistic projection of cash flow? Will your rent revenue be sufficient to cover all of your expenses, including financing? Do you recognize that losing one tenant equates to 100% vacancy? If that occurs, how long can you soldier on without revenue?

Perhaps the most important concept to recognize here is that there is a fundamental difference between a single-family home and a more typical income-property investment. The worth of any investment ought to be related to its ability to produce a return, but generally the value of a single-family home is based on the competitive market for similar properties – in short, comparable sales. So you might be missing out on something here.

Let’s look now at an option that offers what might be the biggest single benefit available to you when you choose real estate as an investment.


View a sample lesson from my online video course,
“Introduction to Real Estate Investment Analysis”


Income-Producing Property, Buy and Hold

In the spirit of full disclosure, my specialty is income-producing property, particularly what is often called “buy and hold.” It’s what I teach and write about, so now excuse me as I get on my soapbox.

This type of property generally includes non-residential (such as office, retail, mini-storage etc.) and apartment buildings with more than four units, though some investors will include four-unit properties as well.

These properties differ in a very important way from those whose main characteristic is to serve as a personal residence. As I mentioned above, the market value of a personal residence is almost always based on comparable sales. Buyers of single-family homes are essentially purchasing a lifestyle – a location and a physical property that offers a basket of amenities. The market value is based on those factors, so they drive what you’ll typically pay to acquire the home, and the price for which you’ll be able to sell.

The value of a true income-property, however, is based on its ability to generate income. The location and attributes of the physical property are not irrelevant, but they matter only insofar as they affect that ability to generate income. You could have two seemingly identical properties side-by-side. One is managed well and produces a strong net income. One is managed poorly, and has a weak bottom line. Physically similar, but the former will command the higher price.

Why does this matter? Unlike with stocks or with personal-residence real estate, you, the investor, have the opportunity to create value, to create equity. How? By increasing the property’s net income.

My favorite personal war story in this regard is about a property that a friend and I bought many years ago. The units were rented significantly below market, and we purchased it at a small premium over what those rents justified. As leases expired we increased rents substantially, just about doubled the bottom line, then sold the property for twice what we paid.

The key point here is that we didn’t have to rely on the sale prices of comparable properties in the neighborhood to increase in order for the value of our property to rise. We were able to create value proactively by doing a better job of managing. We created equity.

This ability to have such a degree of personal control over the success of your investment is something you find in very few investment vehicles outside of income-producing real estate.


The Bottom Line

So what will be your choice, what works best for you?

  • The REIT is certainly easy and liquid, but it is still a stock.
  • The fix-and-flip holds out the possibility of a very big payday, but you need a dependable and capable team that can move quickly; and as with any high upside there is also the greater risk of loss.
  • The single-family rental is an appealing way to break into real estate because of its familiarity, but it’s an investment mainly to the extent that you benefit from external market forces.
  • And then there is my favorite, the buy-and-hold income property. It’s an option that gives you the opportunity to exercise significant personal control over the success of your investment without going into the deep end of the risk pool.

My bias toward the last option notwithstanding, there is no choice that’s right for everyone. Your best decision is an informed decision, and that’s what I hope I’ve helped you reach.

—Frank Gallinelli


Ready to learn more about real estate investing? Visit learn.realdata.com

####

Your time and your investment capital are too valuable to risk on a do-it-yourself investment spreadsheet. For more than 30 years, RealData has provided the best and most reliable real estate investment software to help you make intelligent investment decisions and to create presentations you can confidently show to lenders, clients, and equity partners. Find out more at www.realdata.com.


Copyright 2018,  Frank Gallinelli and RealData® Inc. All Rights Reserved

The information presented in this article represents the opinions of the author and does not necessarily reflect the opinions of RealData® Inc. The material contained in articles that appear on realdata.com is not intended to provide legal, tax or other professional advice or to substitute for proper professional advice and/or due diligence. We urge you to consult an attorney, CPA or other appropriate professional before taking any action in regard to matters discussed in any article or posting. The posting of any article and of any link back to the author and/or the author’s company does not constitute an endorsement or recommendation of the author’s products or services.


Now earn a digital certificate with my video course, “Introduction to Real Estate Investment Analysis”

Professional education is a great thing. And being able to broadcast news of your success makes it even more valuable.

That’s why I’m announcing a new benefit to students who enroll in my course, Introduction to Real Estate Investment Analysis. I’m now awarding a digital Certificate of Achievement and badge to students who successfully complete the course.

Here are some questions you probably want to ask:

What does it cost? For my students: nothing. RealData is picking up the cost of issuing and hosting the certificate.

What do you mean by “digital certificate?” Your certificate will be hosted by Accredible.com, an industry-leading credentialing platform. As you’ll see below, it’s designed so you can share it easily.

Does that mean I don’t get a physical certificate to hang on my office wall? No, you also get a pdf version you can print.

What’s so special about this digitally hosted certificate?  So glad you asked. Here are a few things you couldn’t do with a traditional certificate:

  • You receive a unique url for your Certificate, so you can share it with employers, clients, industry groups, just about anyone.
  • You can share it on any of your social media networks with just a click on a toolbar.

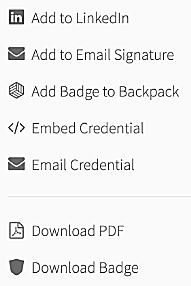
 Your personal certificate page includes a dashboard, as shown at the left. From there you can…

  • Add it to your LinkedIn profile
  • Add it to your email signature
  • Get the code to embed it in your website
  • Email it to anyone
  • Download it as a PDF
  • Download a badge image, which you can attach to your email signature, put on business cards, etc.
  • Add “evidence” to your certificate to increase your credibility — examples of your work, videos about yourself, links to projects you’ve been involved with – and even more

How do I obtain my certificate?Within a few days after you complete the work to earn your certificate, we’ll send you an email with instructions to access it. If you believe you’ve completed the requirements but haven’t heard from us, please contact us at mailto:education@realdata.com

Terms of Use: Please review our common-sense Terms of Use

I believe our online video course provides a solid educational opportunity for those who want to learn about real estate investment and development. I hope this digital certificate will recognize your efforts and will benefit you for devoting the time and effort to pursue that education. I look forward to contacting you when you complete your coursework!

Frank Gallinelli


Learn by Example

I’ve seen a great deal of interest in the real estate investment case studies that are part of my investment analysis video course — so I’ve spun those cases off as a new mini course, one where you can learn by example.

The cases deal with three different property types:

  • apartment building,
  • mixed-use, and
  • triple-net-leased

They’re similar to those I cover in my grad-school course at Columbia, and I’ve designed them with several purposes in mind:

  • To give you practice working through bumper-to-bumper deal analysis. On what terms does each deal make sense to you?
  • To introduce special situations that you need to understand, such as expense recoveries and triple-net leases.
  • To give you an opportunity to put yourself inside the deal as if you were a real participant, to think as an investor thinks — beyond the numbers, beyond the surface data, as if real money were on the table.

Once you’ve learned about deal analysis with this mini course, you’ll probably want to take the complete course, covering detailed real estate investment metrics, partnerships, development, and more. So here’s more good news:

When you upgrade to the bigger course, you’ll get full credit for  this mini course.

Learn more about my case study course


Sharpening Your Pencil – Create Better Analyses With Published Real Estate Data

It’s tempting to rush through a property analysis by simply reviewing the broker’s sell sheet, plugging the data into your favorite software program and printing the results. You’re done, right?

Think again.

We’re not saying the seller isn’t providing accurate income and expense data, but is he or she giving you a complete picture of all the issues? Consider such questions as:

  • What is an appropriate cap rate for the market in which the property is located; and more specifically, what’s the prevailing cap rate for the particular sector, such as multi-family or self-storage?
  • What seems like a realistic assumption for revenue and expense growth over time?
  • How have vacancy rates been trending for the area, and what might those trends say about future leases, renewals, and demand for space?

You’ll probably need to look beyond the owner’s statement to build your best property analysis and thus create your best chance at a successful investment. Thankfully, you can find a number of sources online to help you achieve accuracy, and along with it, some peace of mind.  You can find data on:

  • Metropolitan and submarket area cap rates
  • Average rents by market sector
  • Vacancy rates
  • Number of units available and sold
  • Sales and rental comps
  • Custom reports based on your subject property

The following are some of the best-known sources of data:


Zillow

https://www.zillow.com/research/data/

You’re probably already familiar with this site, at least in regard to its home value estimates. The focus here is residential but investors can benefit from their extensive rental information, which is provided by county, metro area, city, zip code, and even neighborhood.  You download data in Excel format. We found their series of 5 to 7 years of data particularly useful for evaluating rental trends.

You can also learn about their methodology here.


Moody’s Analytics (formerly Reis)

https://cre.moodysanalytics.com/

Reis has been a source of commercial real estate data for nearly four decades, and say they are a “…source for property and market intelligence, including vacancy rates, rent levels, cap rates, new construction, rent comparables, sales comparables, valuation estimates, and capital market trends across eight major commercial real estate sectors.

You can get more info about their data products at https://cre.moodysanalytics.com/products/


Costar

http://www.costar.com

Really big data commercial real estate here, for owners, brokers, appraisers, lenders, even institutional investors

They say you can search up to 1 million sales records, across all property types at https://www.costar.com/products/costar-comps or access property-level data, including vacancy, rents, sales comps for multifamily, office, industrial, or retail property at https://www.costar.com/products/analytics.


Compstak

https://compstak.com/enterprise

Compstak serves up office, retail and industrial lease data for “leading institutional investors, lenders, and owners across the US and UK.”  Subscribe to their entire database or, if you are broker, appraiser or researcher, trade your own data for theirs and gain access to Compstak data for free.

Real Capital Analytics

https://www.rcanalytics.com/solutions-for/investors-owners/

From macro trends to extensive data on individual properties, Real Capital Analytics offers data on “$18 trillion of sales, recapitalizations and financings.”  Contact them for pricing.


Redfin

https://www.redfin.com/blog/data-center

Redfin is a residential brokerage firm but offers a wide variety of property sales and trend data.  Of particular note is their annual report of the “Hottest Neighborhoods in the US.”

While you may not be an investor in single family homes, consider that the market for your commercial property is linked to the health of the local residential market.


LoopNet

http://www.loopnet.com/salescomps/

Gain access to their database of 1.6 million sales listings.  Cost is $175 per month.  They also offer, at no charge, sales and lease trends for hundreds of localities across the US.  See http://www.loopnet.com/markettrends/


What data sources do you use? Share your thoughts by commenting below.


New Version of our Income-Property Video Tutorial

Screenshot 2016-06-30 09.36.08
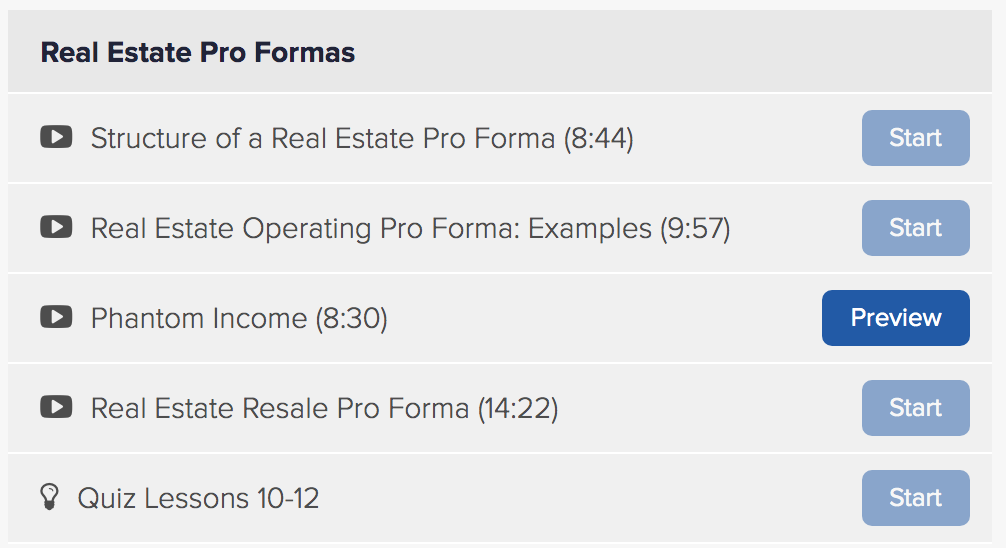
We’ve just released an updated version of our video tutorial, How to Evaluate an Income Property Investment with REIA Pro. We’ve given the video a serious makeover — additional content, better audio and graphics, greater emphasis on how to use RealData’s REIA software to perform an analysis — and have added a seventh video that provides an overview of some of the software’s more advanced features.

•    You get access to the web-based video series on our new e-learning platform. Watch it online at your convenience — on your desktop or mobile device.
•    The property analysis is based on a sample case study of a mixed-use property.
•    The series uses our REIA Pro product to analyze the investment, but many of of the features portrayed in the videos are found in the REIA Express edition.
•    The series is presented by Frank Gallinelli, founder of RealData, Inc.
•    Includes seven videos with over 2 hours of instruction

If you’ve already purchased the original release of this series, you’ll receive an email with instructions on how to get the new version at no charge. If you haven’t purchased it before, we invite you to download the case study and view a lesson-by-lesson synopsis.


Real Estate Project Feasibility – What’s Behind Door #2?

door_1_2In an earlier article we discussed the first of two ways that developers traditionally use to look at the feasibility of income-property projects. That one was called the “Back Door” approach. It will come as no surprise to learn that we call the other method the “Front Door” approach.

The difference between these two approaches lies in what you consider to be the unknown variable. With the Back Door, you believe you know the rental rate that you can obtain for the space once it is built. You also know the cost of financing your project and what you consider to be an acceptable rate of return on your own equity investment. Blend this all together and what you’re really saying is that you know the revenue stream and want to figure out is the maximum total project cost that you can support with that revenue stream.

Once you get that far, you can refine the process a bit by breaking the total project cost into land and improvements. If you can estimate your cost for improvements, that allows you to back into the maximum land value that you can justify for this deal. We say land “value” rather than “cost” because you may already own the land. If that’s the case, then the decision you reach via the Back Door is whether or not the project you have in mind is in fact the best economic use of your land.

As its name suggests, the Front Door approach is a bit more direct. In this case you believe you know the total project cost – your outlay for improvements and the cost or value of your land. Now the unknown variable is the revenue stream. What rent must you generate in order to make this deal worthwhile? To ask this question another way, if you charge market rent does the deal provide an acceptable return?

Let’s look at an example. We’ll start with the project cost, which is made up of hard costs, soft costs and land. Recall from the earlier article that hard costs include construction as well as related items such as civil/mechanical utilities and environmental remediation; and soft costs include architectural and engineering, loan fees, development loan interest, legal fees, zoning-related costs, permits and similar items.

Hard costs: $1,700,000
Soft Costs: $750,000
Land Costs: $350,000
Total Project Cost: $2,800,000

The market capitalization rate for properties like this in your area is 11%. (If you haven’t done so already, you should read our article about cap rates in the Learn section of realdata.com. Even better, my book, What Every Real Estate Investor Needs to Know About Cash Flow…, provides a detailed tutorial.) In order for the property to yield such a rate, it needs to have a Net Operating Income that we calculate as follows:

Net Operating Income = Cap Rate x Value
Net Operating Income = 0.11 x 2,800,800
Net Operating Income = $308,000

We need a few more puzzle pieces to complete the picture. We know that we are building a project that will offer a total of 20,000 square feet of rental space. We must build in an allowance of 3% of the Gross Scheduled Income (the total potential rent) for possible vacancy and credit losses. We estimate that our operating expenses (property taxes, insurance, etc.) will be $50,000 for the first year. We can use the same format as we did in the Back Door analysis:

Total Rentable Square Feet x Average Rental Rate
= Gross Scheduled Income
– Vacancy and Credit Allowance
= Gross Operating Income
– Operating Expenses
= Net Operating Income

Let’s fill in what we know:

20,000 x Average Rental Rate
= Gross Scheduled Income
– 3% of Gross Scheduled Income
= Gross Operating Income
– Operating Expenses of 50,000
= Net Operating Income of 308,000

I’ll spare you the algebra involved and reveal the precise answer in a moment. It is for times like this that you use professional real estate software, so I’ll digress to suggest that you look at our Commercial / Industrial Development software, which we have offered since 1983. It’s designed specifically to analyze development projects and to help you sort out this sort of front-door back-door feasibility.

In real life what you would probably do next is to plug in the current market rental rate to see if in fact it would give you at least a $308,000 Net Operating Income, thus demonstrating that the project is feasible. Let’s say that the market rate for this space is $18.50 per square foot per year and try that:

20,000 sf x 18.50 per sf
= Gross Scheduled Income of 370,000
– 3% of Gross Scheduled Income of 11,100
= Gross Operating Income of 358,900
– Operating Expenses of 50,000
= Net Operating Income of 308,900

We were looking to achieve a NOI of $308,000, so for all practical purposes we nailed it. Based on these numbers, the project makes sense. For those readers who labored to calculate the exact rate to get the $308,000 NOI, it is a fraction of a cent more than $18.45.

Neither the front- nor the back-door approaches is a just brain teaser. These are effective methods to look at income-property projects to help you decide if they make economic sense.

—-Frank Gallinelli

Want to learn more about real estate investing? Visit learn.realdata.com

####

Your time and your investment capital are too valuable to risk on a do-it-yourself investment spreadsheet. For more than 30 years, RealData has provided the best and most reliable real estate investment software to help you make intelligent investment decisions and to create presentations you can confidently show to lenders, clients, and equity partners. Find out more at www.realdata.com.


Copyright 2016,  Frank Gallinelli and RealData® Inc. All Rights Reserved

The information presented in this article represents the opinions of the author and does not necessarily reflect the opinions of RealData® Inc. The material contained in articles that appear on realdata.com is not intended to provide legal, tax or other professional advice or to substitute for proper professional advice and/or due diligence. We urge you to consult an attorney, CPA or other appropriate professional before taking any action in regard to matters discussed in any article or posting. The posting of any article and of any link back to the author and/or the author’s company does not constitute an endorsement or recommendation of the author’s products or services.


Real Estate Project Feasibility – What’s Behind Door #1?

If you have ever been involved with the development of income property then you may have heard this dictum: One can describe virtually any development project as…

  • a use looking for a site or
  • a site looking for a use.

Out of this ying and yang school of development arose two classic techniques to assess feasibility: The Back Door and the Front Door approaches.


Let’s first take a look at the Back Door Approach

door_1_2You might employ the Back Door approach if you have a use looking for a site. You know what you want to build and can reasonably estimate the kind of rental revenue it can generate. The question for you as the developer is, “Will that revenue be sufficient to justify the cost of development?”

Presumably, this technique is called “back door” because you’ll back into the maximum project cost that the use will support. Then, like Hamlet examining Yorick’s skull, you’ll ponder it until you decide if you can actually do the deal. In short, if your intended use will support a project that costs $x and no more, you must decide if you can you develop it for those $x.

To do the math, start by determining the extent of rentable square footage that you can build on this parcel. Obviously you need to take into consideration issues such as lot coverage, height restrictions, floor area ratios, parking requirements and so on to determine what is permissible as well as possible. Depending on the complexity of the use, you might then simply multiply the total rentable square feet by the average rental rate or you may need to create a proposed rent roll on a space-by-space basis. In any event, your first step here is to establish an estimate of the project’s Gross Scheduled Income.

From this point, you work through the numbers exactly as you might in our Real Estate Investment Analysis software or as shown in our courseware. From the Gross Scheduled Income you subtract a Vacancy and Credit Allowance. That gives you the Gross Operating Income (or Effective Gross Income, as some prefer to call it). Next you subtract all operating expenses, which leaves you with the property’s expected Net Operating Income.

From here you want to establish the maximum loan amount that the NOI can support. If you want to take the quick route you can download the free real estate calculator program we provide at realdata.com and use the section called, of all things, “Maximum Loan Supported by Property Income.” If you’re a rugged individualist, you can also do the math yourself: Divide the NOI by the lender’s required Debt Coverage Ratio; then divide again by the annualized mortgage constant (which is 12 times the monthly payment amount for a $1 loan at the interest rate and term that the lender will provide).

Now you know the maximum loan that this project can support. The Loan-to-Value ratio should define the relationship of this loan amount to the maximum value of the whole package. So, divide by the lender’s maximum Loan-to-Value percentage and you’ll have the Maximum Total Project Cost. Put it all together and it looks like this:

Total Rentable Square Feet x Average Rental Rate
= Gross Scheduled Income
Vacancy and Credit Allowance
= Gross Operating Income
Operating Expenses
= Net Operating Income
= Maximum Total Project Cost

To put this more succinctly, you started with the gross rent, pared that down to a NOI, found the maximum loan the NOI could support and then applied a Loan-to-Value ratio to reach the Maximum Total Project Cost.

The next step in assessing the feasibility requires you to pick apart that total project cost. The total is made up of three parts: Hard costs, soft costs and land. You know what you’re planning to build, so you can figure the first two:

the hard costs, which include primarily construction but also items such as civil/mechanical utilities and environmental remediation;

the soft costs, such as architectural and engineering, loan fees and interest, appraisal, legal fees, permits and zoning-relating costs.

The hard costs and soft costs combine to represent everything in this project except the value of the land. So, if you subtract those hard and soft costs from the Maximum Total Project Cost, what’s left is this: the maximum value of the land for you to be able to consider this project feasible.

Keep in mind that if you already own the land, it’s the land’s current market value not its purchase price that you want to consider. If the land is worth more or costs more to buy than this maximum value you just calculated, then according to the Back Door approach the deal is not feasible.

Maximum Total Project Cost
Project Hard Costs
Project Soft Costs
= Maximum Site Cost or Value

Example:

You propose to build an income property with 20,250 rentable square feet. The average rental rate will be $20 per square foot. You provide a 10% allowance for vacancy and credit loss and expect operating expenses to total $44,000 per year.

Your lender will provide financing at 8% for 240 months and requires Debt Coverage Ratio no less than 1.2 and a Loan-to-Value Ratio no greater than 80%. What is the Maximum Total Project Cost?

You estimate Hard Costs to be $2,430,000 and Soft Costs to be $625,000

You own the land, which has a current market value of $750,000. Does it seem feasible to build the project on this site?

Start with the Gross Income and work your way through the model above:

20,250 Total Rentable Square Feet x 20.00 Average Rental Rate
= 405,000 Gross Scheduled Income
10% Vacancy and Credit Allowance
= 364,500 Gross Operating Income
44,000 Operating Expenses
= 320,500 Net Operating Income
= 3,326,142 Maximum Total Project Cost

If your lender requires that you have enough Net Operating Income to cover 1.2 times the debt service (i.e. 1.2 Debt Coverage Ratio) then your NOI of 320,500 can justify annual debt payments up to $267,083.

Given your lender’s financing terms (expressed in the Mortgage Constant), the mortgage can support a mortgage of $2,660,913.

If the Loan-to-Value ratio is 80%, that $2.6 million represents 80% of the project’s value; so 100% of its value equals $3,326,142.

What will it cost you to build, not counting the land? Your combined Hard Costs and Soft Costs total $3,055,000. If the Maximum Total Project Cost that the income stream can support – in other words, if the most you should spend on the complete package, given the potential rental income – is $3,326,142 and the cost of physical construction is $3,055,000, then the difference of $271,142 is the most that you can justify spending on the land. But the land is really worth $750,000. So it appears that it won’t make sense for you to build this project on this site. The cost of physical construction plus the value of the land are greater than the rent can support.

For those of you familiar with RealData’s Commercial / Industrial Development software, that program uses some of the back-door rationale while adding a few twists of its own. You can indeed let the program back you into the maximum development loan, but our experience is that developers are interested in projects that are profitable, not just feasible, so you can work with other considerations in that program to guide your project model.

In our next article, you’ll see what it’s like to come in the Front Door.

—-Frank Gallinelli

Want to learn more about real estate investing? Visit learn.realdata.com

####

Your time and your investment capital are too valuable to risk on a do-it-yourself investment spreadsheet. For more than 30 years, RealData has provided the best and most reliable real estate investment software to help you make intelligent investment decisions and to create presentations you can confidently show to lenders, clients, and equity partners. Find out more at www.realdata.com.


Copyright 2016,  Frank Gallinelli and RealData® Inc. All Rights Reserved

The information presented in this article represents the opinions of the author and does not necessarily reflect the opinions of RealData® Inc. The material contained in articles that appear on realdata.com is not intended to provide legal, tax or other professional advice or to substitute for proper professional advice and/or due diligence. We urge you to consult an attorney, CPA or other appropriate professional before taking any action in regard to matters discussed in any article or posting. The posting of any article and of any link back to the author and/or the author’s company does not constitute an endorsement or recommendation of the author’s products or services.


What is Your Marginal Tax Rate, and Why is It Important to You?

marginal tax rateUnless you make your living by helping people complete their returns, you probably prefer to spend as little time as possible thinking about income taxes. The rules and forms are generally opaque and the process is often stressful. However, there is at least one concept in the U.S. tax system that is both very simple and really important, and yet I find that it is unfamiliar to many. That concept is the Marginal Tax Rate, and the short version goes  like this:

Your marginal tax rate is the rate at which your next dollar of income will be taxed.

Now let’s see just how that works and why it matters to you.

Tax Brackets

If the U.S. had a so-called “flat tax,” then each person would pay a fixed percentage of his or her income. For the sake of example (and putting all political agendas aside), let’s say the flat rate were 10%:

$10,000 income x 10% = $1,000 tax

$1,000,000 income x 10% = $100,000 tax

Simple enough, and the person with the higher income would pay a proportionally higher tax.

However, the U.S. has instead what is called a “progressive” tax system. It’s like a layer cake. The bottom layer is taxed at a certain rate; the next layer is taxed at a higher rate; the next at a still higher rate. We call these layers “tax brackets.” Here is what the brackets for a married couple filing jointly looked like in 2015:

Screenshot 2016-02-03 10.37.06

The logic here is that the higher your income, the higher the rate at which that income will be taxed. The tax rate becomes progressively higher as income increases, hence the name.

What Is Marginal Tax Rate?

Your marginal tax rate is simply the rate at which your next dollar of income will be taxed. Let’s say that our married-filing-jointly couple, Jack and Jill, had income only from their jobs in 2015. After deductions, they had a taxable income of $74,900. They are at the top of what we would call the “15% tax bracket.”

Then Jill received a one-time year-end bonus of $1,000, raising their total family income to $75,900. How much of that bonus will be lost to federal tax? Recall our table:

Screenshot 2016-02-03 10.47.12

Every dollar earned starting with dollar # 74,901 (and continuing until 151,200) is going to be taxed at 25%. So she will pay $250 of that bonus in federal tax.

$1,000 x 25% = $250

What Marginal Tax Rate Isn’t

If someone were to ask our couple what tax bracket they were in, they would say, correctly, “25%.” Many people assume, incorrectly, that this would mean they are paying 25% of their total income in taxes. But that is not the case. This couple is paying 10% of their first $18,450 of income, 15% of the next $56,450, and 25% of the last $1,000.

And so, they are actually paying an effective rate that is just a bit less than 14%.

Screenshot 2016-02-03 10.32.27$75,900 income / $10,562.50 tax = 13.92% effective tax rate

Why Does It Matter to You?

Now that you understand how it works, you ask the obvious existential questions: So what? Why do I care?

Knowing your marginal tax rate is essential to anticipating the tax consequences of new income or new deductions. Consider some examples:

Our couple knows that their effective tax rate is currently around 14% but their marginal rate is 25%. What if they decide to acquire a profitable new investment property? They need to recognize that the additional income, which is layered on top of their employment income, is going to be taxed at their marginal rate of 25%. That information may factor into their decision as to whether the income from that property, after-taxes, is attractive enough to justify the cost and the effort.

What if they were thinking about making a $1,000 donation to charity at the end of 2015, or possibly waiting until next year to do so? If Jill’s bonus is indeed a one-time event, she would save $250 on their joint taxes if she makes that donation this year, while she is in the 25% bracket; but she would save only $150 if she waits until next year when she expects to drop back under the 25% marginal rate and into the 15% bracket.

Perhaps in 2016 this couple encounters a fantastic real estate opportunity where they make a quick $85,000 profit. Short-term gains are treated as ordinary income, so add this profit to the $74,900 taxable income they had expected from their jobs and you can see that they will catapult across two tax brackets. At $159,900, assuming the bracket table remains the same, their marginal rate is going to jump to 28%.

Screenshot 2016-02-03 10.47.32

By being aware of their new marginal rate and where it is that they may fall within that 28% tax bracket, they can do some sensible tax planning. It looks like $8,700 of their income (i.e., the amount that their 2016 income is over $151,200), will be taxed at 28%. Are there some 2017 deductions that they could accelerate into 2016? Perhaps they could pre-pay the property taxes on their home. All or part of that deduction would save 28% if they took it the year of atypically high income, versus 15% in a year where their income returned to the 15% bracket.

One word of caution to so-called high-income investors (and that could mean folks with income as low as about $200,000 for individuals or $250,000 for joint filers): There are a variety of potential gotchas lurking for you in the ever-changing tax code. Certain deductions or exemptions may phase out, and the Net Investment Income Tax may kick in. Don’t try parsing this at home; consult a professional tax advisor.

For most people, however, awareness of your marginal tax rate and where you fall in the tax-bracket chart can be a big help in understanding the consequences of changes in income and making informed tax-planning decisions.

—-Frank Gallinelli

Want to learn more about real estate investing? Visit learn.realdata.com

Your time and your investment capital are too valuable to risk on a do-it-yourself investment spreadsheet. For more than 30 years, RealData has provided the best and most reliable real estate investment software to help you make intelligent investment decisions and to create presentations you can confidently show to lenders, clients, and equity partners. Find out more at www.realdata.com.

####

Copyright 2016,  Frank Gallinelli and RealData® Inc. All Rights Reserved

The information presented in this article represents the opinions of the author and does not necessarily reflect the opinions of RealData® Inc. The material contained in articles and blog posts that appear on realdata.com is provided as general information and is not intended to provide legal, tax or other professional advice or to substitute for proper professional advice and/or due diligence. We urge you to consult an attorney, CPA or other appropriate professional before taking any action in regard to matters discussed in any article or posting. The posting of any article and of any link back to the author and/or the author’s company does not constitute an endorsement or recommendation of the author’s products or services.


Start Evaluating Investment Properties Today

Get Free Demo