Important Update: RealData discontinued new software sales on April 30, 2026. Existing software will continue to work, and licensed users should download and save their installers.


In my last article, I covered five advanced metrics that go beyond the cap rate—but I saved the most powerful for last. The Internal Rate of Return (IRR) is arguably the most widely used metric in commercial real estate, and for good reason. It’s often called the gold standard for evaluating long-term investment performance. In this post, I’ll unpack what IRR really means, how to calculate it, where it excels, and where it doesn’t.
What Is IRR, Really?
Technically, IRR is the discount rate that makes the Net Present Value (NPV) of all future cash flows equal to zero. But that’s not always intuitive.
In a nutshell, here’s how it works:
IRR: How It's Derived
1. First, forecast your future cash flows—both the annual operating cash flows and the expected sale proceeds, which you must also consider a cash flow.
2. Discount each year’s cash flow back to today using a chosen rate. That gives you a better idea of what they’re worth in today’s dollars. Time Value of Money. If you’ve been hanging around this website, you’re well acquainted with the concept.
3. Add all the individual PVs up. That gives you the Present Value (PV) of the entire stream of cash flows.
4. Compare that to your out-of-pocket investment. If the Present Value is higher than your cost, the investment might be a winner.
This time-adjusted view helps you assess whether a deal is worth the risk.
Example: Discounted Cash Flow in Action
Let’s say you invest $45,000 of your own cash to acquire a property that will give you these cash flows:
Cash Flows (Undiscounted)
Year 1 3,000
Year 2 3,000
Year 3 3,000
Year 4 3,000
Year 5 3,000 plus 60,000 net sales proceeds
Total 75,000
Now let’s decide to discount cash flows in this market at 10% in order to find out what those cash flows are worth in today’s dollars.
Cash Flows (Discounted at 10%)
Year 1 2,727
Year 2 2,479
Year 3 2,254
Year 4 2,049
Year 5 1,863 plus 37,255 net sale proceeds
Total 48,628
So, you paid $45,000 and the Present Value of your future returns is $48,628. The Net Present Value (NPV) — the difference between the PV of the future returns and what you paid for them — is $3,628.
This tells us that at a 10% discount rate, the deal looks positive. But what if you want to know the exact rate of return that makes the NPV zero? That’s your IRR.
What Makes IRR Different?
Most metrics—like cap rate—focus on a property at a point in time, using a single year’s financial data. IRR captures the full investment lifecycle:
•Year-by-year cash flows
•The timing of those cash flows
•The final proceeds of sale
It’s dynamic and time-sensitive, which makes it a more holistic way to measure performance over a holding period. That also makes IRR a useful tool for comparing opportunities across asset classes—real estate vs. stocks, bonds, or even a private business.
Flip the Script: Solving for IRR
In a typical DCF, you pick the discount rate and calculate the Present Value. But with IRR, you know the initial investment and the projected cash flows, and you solve for the rate that makes the NPV zero.
In plain terms: What return are you actually getting based on what you put in and what you expect to get out over time?
That’s what IRR reveals.
Bonus: If you’re not keen on solving complex equations, tools like our Real Estate Investment Analysis software do the heavy lifting for you—no sweat, no DIY spreadsheets for you to build.
Timing is Everything
Consider two investments. Same cash in, same cash out. Very different IRRs.
Example A
•Initial investment: ($20,000)
•Year 1–5 cash flows: $1,000 → $2,000 → $4,000 → $8,000 → $18,000
•IRR: 12.86%
Example B
•Initial investment: ($20,000)
•Year 1–5 cash flows: $8,000 → $4,000 → $2,000 → $1,000 → $18,000
•IRR: 16.52%
Even though the total dollars returned is the same, the timing of the cash flows dramatically changes the IRR. Money received earlier is more valuable due to the time value of money.
This is why IRR is so insightful. It not only answers how much, but when—and that matters a lot in real estate.
When to Sell? Let IRR Help
A valuable use for IRR lies in helping you decide how long to hold a property. Say you run forecasts on a property with these IRRs at potential different sale points:
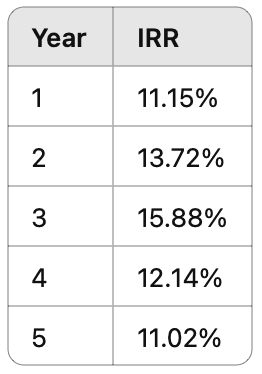
In this case, there is a clear peak, followed by a drop-off in IRR. Year 3 delivers the highest IRR—suggesting that might be the optimal time to sell and reinvest.
Where IRR Shines — and Where it Doesn't
IRR is powerful because it captures both the magnitude and the timing of returns. It accounts for all future cash flows and weighs them by when they occur. That makes it ideal for:
•Long-term hold analysis
•Comparing multiple income-property opportunities
•Comparing dissimilar investments (e.g., real estate vs. stocks or startups)
•Modeling different exit strategies
•Seeing the impact of front-loading or back-loading returns
But IRR isn’t perfect. Technically speaking, it’s not a “calculated” value, but one that’s derived through successive approximations. Because of that, it can sometimes throw you a curve.
Here are some potential drawbacks:
•Reinvestment Assumption
IRR assumes that all interim cash flows are reinvested at the same rate as the IRR itself. That can be unrealistic. For instance, if an investment returns 18%, can you really reinvest those early returns at 18% too, especially if they’re modest amounts? Probably not.
•Multiple IRRs
If cash flows alternate between negative and positive more than once, the math behind IRR can produce multiple IRR values from the same data. In these cases, IRR can prove unreliable. I’ll address this, and the reinvestment issue in another article on Modified Internal Rate of Return (MIRR).
•Highly Sensitive to Timing
Didn’t I say this was its greatest strength? Yes, but it can also be turned into a weakness. As we saw above, changes in the timing of cash flows—especially sale proceeds—can swing the IRR significantly. This makes it easy for someone to game property’s projections if you’re not careful and observant.
Final Thoughts
IRR isn’t just another acronym. It’s a powerful way to analyze the true return on your investment—accounting for both magnitude and timing.
While no single metric should drive your decision-making, IRR can offer real clarity when comparing deals, modeling exit strategies, or weighing real estate against other investment vehicles.
Ready to get your numbers right?
Try our Real Estate Investment Analysis software to calculate IRR and other key metrics—fast, accurate, and presentation-ready.
And to learn more about all these metrics and how to underwrite different property types, see our online video courses at learn.realdata.com/courses.
Mastering Real Estate Investing
Learn how real estate developers and rehabbers evaluate potential projects. Real estate expert Frank Gallinelli — Ivy-League professor, best-selling author, and founder of RealData Software — teaches in-depth video courses, where you’ll develop the skills and confidence to evaluate investment property opportunities for maximum profit.