


In my last post, I argued that AI makes the fundamentals more important, not less, because you need to understand when the analysis may go astray.
Assuming you know the fundamentals of real estate investment analysis, now you need to know how to ask AI the right questions to evaluate a potential income-property investment.
Ask a generic question, get a generic answer. Type “Is this a good real estate investment deal?” into an AI assistant and you’ll likely get a response that’s less than definitive. Not something that would make you comfortable committing serious cash.
Give it a properly constructed series of prompts and you get an operating statement you can check, a five-year projection, and an exit price. You also find out which assumption the return depends on, and that is often not the one the broker is talking about. However, keep in mind that this process is iterative. You may need to make adjustments for your unique scenario, as you’ll see in the case study below.
Here’s how this works on a realistic multifamily deal, a six-unit apartment building, and where the analysis pays for itself.
The ground rules
The AI doesn’t know your property. It has no idea what the actual rents, tax bill, or insurance premium are at 412 Chat Street. If you don’t supply those figures, it may invent them, convincingly. Every prompt that follows either feeds it real data (pun intended) or forbids it from guessing.
The AI is an analyst, not an oracle. It’s quite good at structure, math, and scenario logic. It’s very bad at knowing things you didn’t tell it. The working rule: You bring the data; the AI does the analysis.
The ideal prompt has five parts:
- a role for the AI tool
- the context (your data)
- a specific task
- a required output format
- operating rules that keep it honest
The deal
Six units, built around 1978, asking $830,000. The broker’s flyer leads with “value-add opportunity, 7.4% cap.” Here is the rent roll, actual and market:
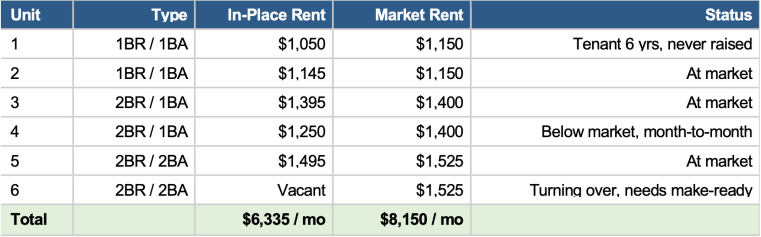
That $1,815 gap between $6,335 and $8,150 is what the broker is selling. Look at where it actually comes from. $1,525 of it is Unit 6, which is simply empty. Another $150 is Unit 4, the month-to-month tenant. The four remaining units, all under lease, are collectively about $140 a month below market.
This is not a building full of underpriced apartments. It’s a building with a vacancy and one soft lease. An AI will happily take that $1,815 gap at face value and call it a value-add. It won’t tell you that most of the gap is one empty apartment unless you make it look.
Prompt 1: Build the APOD
The Annual Property Operating Data is step 1. Note what this prompt won’t permit: taking a shortcut by relying on percentage of rent. “Maintenance is 8% of gross” is how you crank out a number, not how you produce a credible and usable estimate. A six-unit building has some specific, knowable costs, and we’re telling the prompt to insist on them.
The Prompt:
You are a conservative multifamily underwriter. Assume the broker’s numbers are optimistic.
Six-unit building, 1978 construction. Rent roll attached. Owner pays water/sewer, trash, common-area electric and gas, and landscaping/snow. Taxes $11,400/yr; insurance $6,200/yr. Laundry income roughly $150/month.
Build a year-one operating statement. Underwrite gross potential rent at MARKET rents, then deduct a vacancy and credit loss factor. Don’t just use in-place rents, and don’t assume the below-market units convert instantly. State your vacancy assumption and defend it.
Itemize operating expenses as specific line items with a stated basis: per-unit, per-square-foot, or actual quoted figures. Do NOT express maintenance, turnover, or reserves as a blanket percentage of rent. I want to see the math behind each one.
Then calculate EGI, total OpEx, the operating expense ratio, and NOI. Give me two return measures, labeled, with the denominator stated for each: (a) the going-in CAP RATE, NOI divided by the $830,000 purchase price — this is the market-comparable metric, and the denominator must match what comparable sales use; and (b) the YIELD ON COST, stabilized NOI divided by my total project cost of $855,000, which includes the $25,000 I must spend to make the vacant unit rentable and address deferred maintenance. Tell me what the spread between the two says about this deal. Treat reserves for replacement as a capital item below the NOI line, not as an operating expense, and state that convention explicitly in your output. Flag every figure you assumed rather than received.
It should produce something like the table below. Note what this is: a stabilized snapshot, built on market rents. It tells you what the building throws off once the rents are where they should be, which is not the same as what it throws off in year one.

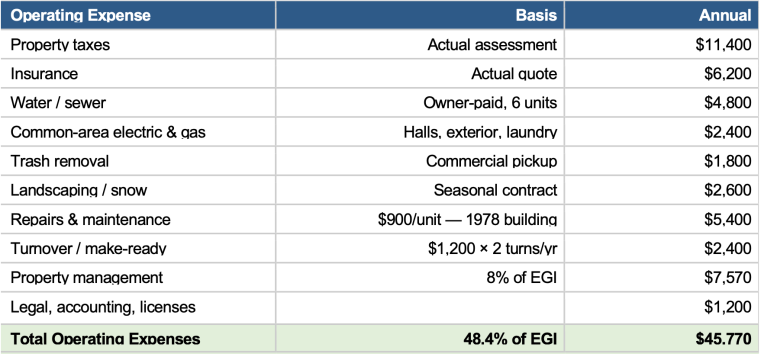
NOI: $48,850 ($94,620 EGI minus $45,770 OPEX)
Going-in cap rate: 5.89%, not 7.4%. That’s $48,850 of NOI against the $830,000 asking price — and the denominator matters. A cap rate is a comparison tool: you check it against what similar buildings actually traded for, so it has to be computed the same way those comps were, on price. Put your renovation budget in the denominator and your number is no longer comparable to anything published.
But price alone doesn’t capture what this deal costs you. Add the $25,000 the building needs before it can produce those rents and you get a total project cost of $855,000, which yields 5.71%. That’s your yield on cost, and it answers a different question: not “is this priced in line with the market,” but “what does my whole outlay actually return.” Track both. The gap between them — 18 basis points here — is the price of the work you’re taking on.
The broker’s 7.4% was computed on market rents as though they were in place, with no vacancy factor and no management cost (the seller self-manages). Three omissions, and better than a point and a half of cap rate.
This is why the itemization matters. The building has some age so “$900 a unit on a 1978 building” is a number you can actually defend, or be talked out of, if the seller has one that’s better, and defensible.
Prompt 2: Debt, and the coverage problem
The Prompt:
Assume 30% down, 6.75%, 30-year amortization. Closing costs $16,600. Budget $25,000 up front for the vacant unit make-ready and deferred maintenance, plus $9,000 to fund a replacement reserve account at closing.
Calculate the loan amount, monthly principal and interest (show the amortization inputs), annual debt service, DSCR, year-one cash flow, total cash invested, and cash-on-cash return.
Loan: $581,000. Monthly P&I: $3,768. Annual debt service: $45,220.
DSCR: 1.08. That is a number that matters, and it’s a problem. Most lenders want 1.20–1.25 on a stabilized five-plus-unit property. At in-place performance, this deal doesn’t clear the bar, which means either the lender reduces the loan offer (requiring more cash in), or the loan doesn’t happen at the terms assumed. Cash-on-cash on today’s actual rents is a negligible 1.2% on $299,600 of cash invested.
An investor reading only the going-in numbers walks away. An investor reading only the broker’s pro forma buys. Both are reasoning from an incomplete picture, because the deal isn’t about year one.
Prompt 3: The hold: Where the deal proves itself or doesn’t
The argument for buying this building is a vacant unit you can fill and a lease you can raise. Neither happens on the day you close, so the prompt has to force the AI to build the rent schedule unit by unit, lease by lease. Not a simple percentage. You need a schedule you can check.
The Prompt:
Project a five-year hold. Build the rent forward UNIT BY UNIT, not as a blended percentage. For each unit, tell me the year its rent reaches market and why: the vacant unit needs a make-ready and a lease-up period before it produces anything, the month-to-month tenant can be raised almost immediately, and the tenants under lease cannot be touched until those leases expire. Give me a table of scheduled rent per unit per year. Then apply vacancy and credit loss to that schedule, and reconcile year one back to the stabilized operating statement so I can see exactly why they differ.
Grow rents 3% annually and operating expenses 3.5% annually. Expenses have been outrunning rents, and I want that reflected, not smoothed away.
For each year, show: EGI, OpEx, NOI, DSCR, cash flow, and ending loan balance. Tell me the first year DSCR clears 1.20. Reconcile year one back to the stabilized operating statement.
Run properly, the AI has to show you the schedule before it shows you a projection. Here is what the rents actually do, unit by unit, as leases roll:
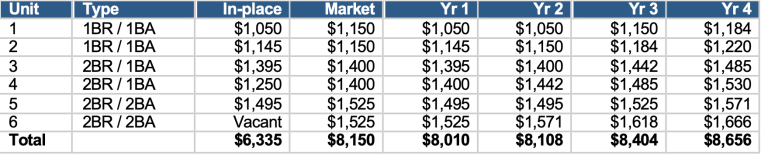
Now the five-year numbers have somewhere to come from. Every figure below traces back to that schedule, which means you can check it, and so can a lender.
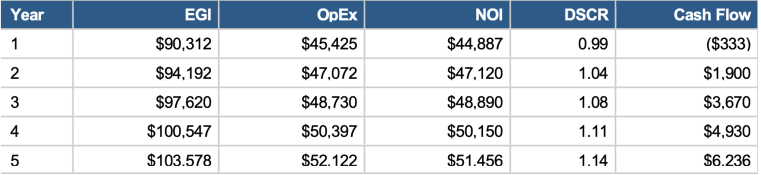
Reconcile year one against the operating statement above. The stabilized APOD showed effective gross income of $94,620. Year one shows $90,312. The difference is not an error. The APOD assumes six occupied units at market rents: $8,150 a month, $97,800 a year. Here is what actually arrives:
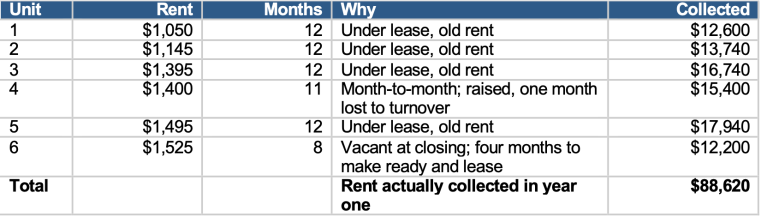
$88,620 collected against $97,800 of potential. That’s a shortfall of $9,180. It’s the cost of the value-add, and it is the line a broker’s pro forma will never show you. Add $1,692 of laundry income, net of vacancy, and you arrive at the $90,312 of effective gross income shown in the five-year table.
Year one is negative. The vacant unit, the make-ready, and the months it takes to fill Unit 6 and re-rent Unit 4 at market mean the rent doesn’t cover the debt service in year one. That shortfall comes out of your pocket. DSCR never reaches 1.20, not in any of the five years. That alone is not a reason to walk away. But it’s a reason to know, before closing, that you need cash on hand to carry a negative-cash-flow year and you need to find a lender who will underwrite to a stabilized pro forma rather than the last twelve months’ actuals. Or you need to put more money down so you can get a smaller loan.
Prompt 4: The exit, and the number that decides the deal
Now the part that most casual analyses skip entirely, and it’s the reason a going-in cap rate is a starting point rather than a conclusion. You don’t make serious money on this deal from cash flow; five years of it totals roughly $16,400. You make money, or lose it, on the exit.
The Prompt:
Assume a sale at the end of year five. A buyer will price off forward NOI, so use year-six NOI (year five grown 2%). Selling costs 5%.
Because the exit cap rate is an assumption and not a fact, do NOT give me a single number. Run it at 5.5%, 6.0%, 6.5%, and 7.0%. For each: exit value, net sale proceeds after costs and loan payoff, five-year IRR on my $299,600 (which includes the $9,000 reserve), and equity multiple. Add back the unspent reserve balance, grown at 4%, to my sale proceeds.
Then tell me plainly which input the return is most sensitive to.

Every operating assumption is identical across all four rows: same rents, same expenses, same management, same execution on the value-add. The only thing that changes is the cap rate a future buyer applies. And the return swings from an IRR of 5.38% (positive, but perhaps not up to your expectations) to negative 8.43%.
You bought at a 5.89% going-in cap. If you exit at 6.5% (that’s about six-tenths of a point of softening, perhaps within the range of an ordinary interest-rate cycle), then five years of work actually loses money, showing an IRR of −3.68%, which is to say you would have done better in a savings account, with no tenants.
Prompt 5: Turning analysis into a price
A deal that doesn’t work at $830,000 may work at a different number.
The Prompt:
Holding all operating assumptions constant, solve for the purchase price at which this deal delivers (a) a 1.25 DSCR at year-one in-place performance, (b) break-even year-one cash flow, and (c) a 12% five-year IRR at a 6.5% exit cap. The conservative exit, not the optimistic one.
Then draft three negotiation points, each anchored to a specific number in this analysis.
Now you can name a better price and show your reasons why: “Your 7.4% cap is computed on market rents with no vacancy and no management. The real NOI is $48,850. At a 6.5% cap, which is what buildings like this are actually trading at, that supports $751,000, and I still have to spend $25,000 to make Unit 6 rentable. My number is $726,000.”
Keeping the machine accurate
Force the assumptions out into the open. End every analysis with: “List every number you assumed versus every number I gave you, and rank them by how much the IRR moves if each is wrong.” On this deal, that ranking puts exit cap first by a wide margin.
Ban the blanket percentage. “Maintenance = 8% of rent” is a number without a thought behind it. Insist on a per-unit or per-square-foot basis with a stated rationale. The moment an AI has to defend $900 per unit on a 1978 building, the estimate becomes something you can actually test.
Name the metric, and the denominator. Cap rate and yield on cost are not synonyms. Cap rate divides NOI by price and exists to be compared against market evidence. Yield on cost divides stabilized NOI by everything you put in, and measures your execution. Ask for both, always labeled, and make sure whatever NOI convention you use matches the one the market’s cap-rate evidence was built on. Comparing an after-reserves NOI to a before-reserves market cap will make a fine building look overpriced.
Never accept a single-point exit. An IRR quoted without a range of exit caps tells you nothing. Ask for the sensitivity table, every time.
Verify independently. AI math has improved greatly, but can still make mistakes. Check against your own model or dedicated real estate analysis software.
The bottom line
Everything in this article is about getting a better answer out of the AI machine. Careful prompting can strip the optimism out of a broker’s flyer, expose the negative cash flow in year one that the pro forma smoothed over, and show you how much of your return depends on the cap rate a buyer applies five years from now.
But notice what none of those prompts did. They didn’t tell you whether to buy the building.
The exit-cap table is a good example. It hands you four outcomes, from a 5.4% return to a loss. Which one you should plan around isn’t a question the AI can answer. That depends on what you know about this market and asset class, what kind of return other investors are achieving, and what you’ve watched cap rates do over time. It depends on whether you have the cash to cover the first year’s shortfall, and whether you believe the rent gap is real or the seller’s fiction. None of that is in the prompt.
Good prompting is essential. It is not sufficient. As I argued in the last post, the AI produces an analysis, but evaluating the output requires that you apply your expertise. The prompts in this article will lead you to an analysis worth vetting.
In drafting the analysis figures above, AI built an operating statement that deducted a vacancy allowance from the rents but took the laundry income at full value.
The math was flawless. The reasoning was not: If a unit is empty, nobody there is doing laundry.
I caught the mistake because after years of doing analyses like these, I knew the laundry revenue should have been reduced along with the occupancy. But it wasn’t.
The AI didn’t make a math error. It made an error of understanding, and then computed it perfectly. But then I had to ask it to re-run the entire five-year projection and the exit analysis, because that one line propagated into every figure downstream.
v2, modified 7/18/2026
This article is intended strictly as educational and not financial, investment, tax, or legal advice. AI-generated analysis can contain errors; verify all figures against primary sources, actual leases, tax records, insurance quotes, inspections, and consult qualified professionals before making any investment decision.
Fittingly for the subject matter, this article was drafted with the help of Claude’s AI, then fact- and math-checked, edited, and argued with by a human, which is rather the point.