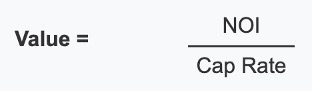
Most real estate investors learn about capitalization rate (cap rate) early on—and for good reason. It’s a useful, at-a-glance measure of a property’s income in relation to its market value.
But cap rate has its limitations: it reflects only a single year of net operating income (NOI), ignores financing, and says little about long-term performance. It looks at a property at a point in time, not over the long term.
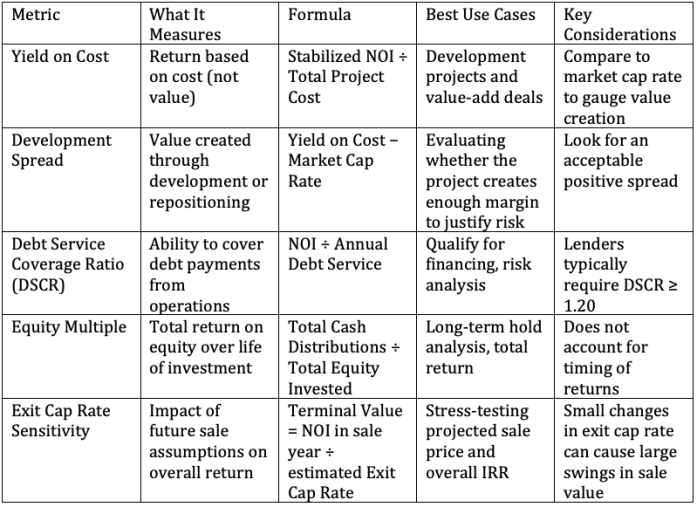
If you’re serious about evaluating income-producing real estate—especially in a competitive or uncertain market—you need to go deeper. In this article, I’ll walk you through five advanced metrics that provide a more comprehensive and strategic view of a commercial investment’s potential. Ready for that deeper dive?
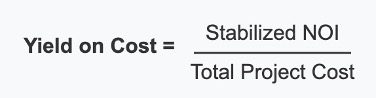
Yield on Cost (sometimes called return on cost) is especially useful in development and value-add scenarios. It tells you what your expected return will be based on the cost to acquire, develop, or improve a property, rather than basing it on its market value.
Formula:
To repeat: Cap rate measures income in relation to the value of a property. Yield on cost measures income in relation to the total cost of the property.
For example, you decide you’re going to buy a property today for $1 million because the NOI is $50,000 and the market cap rate of 5% (i.e., 50,000 divided by 5% cap = $1 million value). Your plan is to upgrade the property and raise the rents.
You’ll spend $50,000 on improvements so you can bump up rents by 30%. Let’s see how that looks:
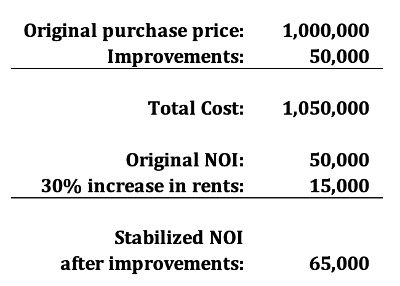
Now you have a new total cost for the property of $1,050,000 – the purchase price plus the improvements — and a stabilized NOI that’s 30% higher than before, or $65,000. Let’s use the Yield on Cost formula, which basically looks a lot like the cap rate formula:
YOC = stabilized NOI / total cost
YOC = 65,000 / 1,050,000 = 6.19%
You notice that the yield on cost is higher than the cap rate—which leads us to another metric that often lives below the radar.
DSCR (aka DCR) measures how comfortably your property’s net income can cover its debt payments. Lenders use it to assess loan viability, but you should use it too—to understand your downside protection.
Formula:
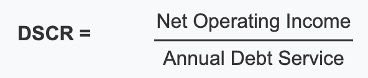
A DSCR of 1.0 means you expect to have just enough net operating income to pay your debt service—not a dollar to spare. No allowance for a missed rent payment, a property tax increase, or even a faucet washer.
No lender I’ve ever encountered would consider giving a mortgage on an income property whose net revenue wouldn’t comfortably cover the debt payments. Most lenders want to see 1.20 to 1.30, perhaps even higher with riskier property types.
Regardless of your lender’s requirements, if your deal projects a tight DSCR, any unexpected hit to your NOI could leave you reaching beyond the property and into your own pocket to cover the mortgage payment. Not a situation you want to be in.
While IRR (Internal Rate of Return) gets a lot of attention for accounting for time value of money, equity multiple can be a simpler, intuitive way to evaluate an investment’s total return.
Formula:
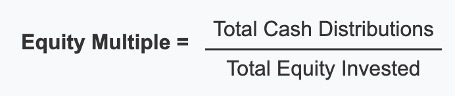
If you invest $500,000 and receive $1,250,000 over the life of the deal—including your annual cash flows plus sales proceeds when you dispose of the property—your equity multiple is 2.5. In other words, over the life of your ownership, you pull out 2.5 times as much cash as you put in.
We’re going to save a discussion of internal rate of return for another article because it will deserve some extra space, but unlike IRR, equity multiple doesn’t consider when you receive your returns but only how much. Although there is no time-value-of money component here, many investors choose to use this along with IRR to compare potential outcomes among investment options.
This metric can provide a helpful perspective, especially if you have a time horizon in mind. Say, for example, that your goal is to cash out with the funds needed to retire in 30 years, or to pay for a child’s education in 15. Total cash received may mean more to you than the specific timing, or a rate-of-return threshold. Seeing the total expected return over the life of an investment can provide a more intuitive sense of the success of an investment.