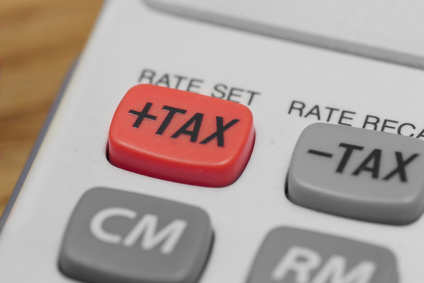
We’ve been hiding our bundles under a bushel! Find out more >>

800-899-6060

New Mac-Compatible Releases of RealData Software

We’ve supported the Macintosh with Excel-based products since the Mac first came out in 1984.  (In fact, way back then we received an award as one of “100 Most Important Companies on the Macintosh.”)

But a few years ago, Microsoft threw us a real curve when they dropped VBA macro functionality from Excel 2008 for the Mac.  As you may know, it’s those complex and sophisticated macros (which you can’t see) that make our software really powerful and easy to use. So our Mac users had to settle for Excel 2004 to run our software

Thankfully, Microsoft has seen the light and restored VBA in their new Excel 2011; and we wasted not a moment getting to work re-writing our products to make good use of the new Excel. It was no small task, but  now all of our products are truly Mac-compatible.

Not only will you have the advantage of Excel’s new interface and features, but you’ll now be able to use the latest versions of RealData software on your Mac — even REIA Express, Version 2 and the RealData Real Estate Calculators — and you’ll see all of our programs run at speeds that are orders of magnitude faster than they ran with Excel 2004.

(A sidebar note: Because these programs are not simply spreadsheets, Windows versions won’t work properly on the Mac and vice-versa. That’s why we created these new releases specifically for the Mac.)

We’re glad to be back offering the latest and best of our software for our loyal Mac customers.


Making the Case for Your Commercial Refinance, Part 2

In Part 1 of this article, you learned what information you need to assemble to get started with the process of refinancing your commercial property — information about your property’s income, expenses and loan balance, and about the prevailing cap rate in your market. You also learned to use some of that information to estimate the current value of the property, then learned to take that result to determine if the property will likely satisfy the lender’s Loan-to-Value requirement.

You got acquainted with Debt Coverage Ratio and mortgage constants and saw how to combine those to test your property’s income stream to find out if it’s strong enough to support your loan request.

Now you have some idea of what your property is worth and how likely it is to appeal to an equity partner or to satisfy a lender’s underwriting requirements. Your next task is to convey your evaluation to that potential partner or lender. You need to make your case with a professional presentation that is easy to grasp but also provides enough detail to support your evaluation of the property and your request for financing.

Unless you’re a “flipper,” you can expect to be involved with this property for the long haul, more or less. It should come as no surprise, therefore, that a lender or investor will appreciate getting a sense of how you believe this property will perform over time. You’re not going to predict the future with precision, but in most situations you should be able to make some reasonable and realistic “pro forma” projections of future performance. There is no hard-and-fast rule, but I believe your projections should go out five to ten years. With commercial properties that have long-term leases in places, 20 years would not be unthinkable.

As we develop the pro-forma presentation through the rest of this article, we’ll be using the Standard Edition of RealData’s Real Estate Investment Analysis (REIA) software. Those readers who are familiar with the software will also note that I’ve taken a few liberties with the material I display, editing some of the images (for example, removing multiple mortgages) to allow you to keep your focus on just the key elements of this example.

Where to start? You’re dealing with rental property, so a rent roll would be a good place to begin. And let’s assume that “today” is January 1, 2009. List your rental units (or groups of units, if you have a large number) with the current rent amount and your estimate of how those rents will change over time. You’ll recall from the APOD you constructed earlier that you expect the total gross scheduled rent for this property to be $219,600 in the first year. For the sake of making this example worthwhile, assume that the property contains both residential and non-residential units, and therefore the total amount of revenue is divided between the two types.

With residential units — apartments, for example — the process of building your rent roll will be fairly straightforward. The rent for each unit of this type is usually a fixed monthly amount. Residential tenancy agreements are seldom long term, most often a one-year lease or even month-to-month occupancy. It’s reasonable to assume that you will try to increase your overall rents on an annual basis. For the first year, you have the following:

sample residential rents, first year

Demand for your apartments has always been strong, but you decide you want to be conservative in your estimate of how much more you can charge each year so you decide to project that these rents will rise at an annual rate of 3%.

sample residential rents, five years

This is a mixed-use property, which means it contains commercial as well as residential rentals. At street level, below the apartments, you have two retail spaces. The first of these is a hardware store, Nuts & Bolts. This store occupies 1,000 rentable square feet and currently pays $21.60 per square foot per year. Its lease calls for a rent increase to $23.50 in July of 2011 The second tenant is Last National Bank, which occupies 2,800 square feet at $25.00 per foot. This tenant’s rent is scheduled to rise to $28.00 per square foot in September of 2012.

Note how your handling of commercial rentals differs from residential. One difference is that you typically charge rent by the square foot rather than by the unit. In most U.S. markets, the rent is expressed in terms of dollars per square foot per year, although in some it is per square foot per month. A second difference is in the length of the lease. As noted earlier, a residential tenant’s commitment may be as little as month-to-month, and generally is not more than one or two years. Commercial tenants, in order to maintain and operate a business from their space, need the certainty that they can continue to occupy for a reasonable length of time. They also need to be able to plan their future cash flow. Hence a commercial lease will usually run for at least a few years, up to as many as 20 or 30.

With the information you have in hand about these commercial leases, you should be able to project the rent from the two commercial units for next several years.

sample commercial rents

The image above is a screen shot from a data-entry portion of the REIA software. This is one image where I haven’t done any editing, i.e., I haven’t removed line items unrelated to our example. I’ve left it complete so you could see that there are other considerations you might need to take into account when you deal with a commercial lease, such as expenses passed through to tenants, leasing commissions, and improvements to the space made by the landlord on behalf of the tenant. We don’t want this article to morph into a full-scale textbook, so we’ll continue to keep our example relatively simple. However, for more information on these and similar topics, you can view our educational articles at realdata.com or refer to the software user’s guide forReal Estate Investment Analysis.

You now have a forecast of the revenue from both the residential and commercial units, and can consolidate this data to include as part of your presentation to your lender or potential partner.

sample combined income

Recall that when you were estimating the value of the property you used something called an Annual Property Operating Data (APOD) form. That form displayed the total rental revenue, an allowance for vacancy and credit loss, and the likely operating expenses for the current year. To fit the needs of your extended presentation you can expand this form to as many years as you want.

For the purpose of this discussion you’ve been projecting out five years, so you’ll do the same with the APOD. You may want to refine your estimates on an almost item-by-items basis. For example, if property taxes, maintenance and insurance are among your greatest expenses, it makes sense to estimate their rates of growth individually. You probably have some history with these items that you can use for guidance. For some other expenses, such as accounting or trash removal, you may want to apply a general, inflation-based estimate. In this example, property management is one of your biggest costs. You know that it will be billed at $15,740 for the first year, but then as a percentage of collected rent — 7% in this case — for future years, so your estimate will just require that you apply the same rate. If you estimate the future rent reasonably well, then the property management fee will follow.

Let’s say you believe that property taxes will increase at 5% per year, and insurance and maintenance at 4%. For all other expenses, you project a 3% annual increase. Your extended APOD should look something like this:

sample APOD

If you owned this property debt-free, your analysis would be nearly complete. But in fact, your objective here is to build an effective case for refinancing your existing loan, so you really need to demonstrate what kind of cash flow this property will throw off with a new loan in place. You need to take this at least one step further.

Recall from the first section of this article that you estimated the value of the property at $1.45 million, and that you need to refinance your $975,000 loan at 7.75% for 15 years. With that information in hand you can complete the taxable income and cash flow sections of your pro forma.

sample taxable income

sample cash flow

These projections should help you make a strong case for approval of your new loan. With that new loan in place, your debt coverage ratio is more than ample in the first year, and improves each year thereafter. Your cash flow is strong, and it too grows each year. It’s strong enough, in fact, that you could even survive the loss of one of your commercial tenants without plunging into a negative cash flow.

Your Net Operating Income is also going up smartly. Perhaps your lender is concerned that the current prevailing cap rate of 11% will rise to 14% by 2013, possibly reducing the value of the property dangerously close to the amount of the mortgage. Does that look like a genuine cause for anxiety?

Remember your cap rate and LTV formulas for the first part of this article.

Value = Net Operating Income / Capitalization Rate
Value in 2013 = 177,839 / 0.14
Value = 1,270,279

So, if cap rates rise to 14% and your NOI is indeed 177,839, then the property should still have a value of about 1.27 million. This is not good news for you, but does the lender have reason to lose sleep?

What will your loan balance be at the end of 2013? You will have been dutifully paying it down from now until five years hence, so surely you will have made a dent. If you return to the REIA software, you’ll find that it includes amortization schedules for all of your property loans. It also tracks the end-of-year balance for each loan as part of its resale analysis, so let’s look at that:

sample mortgage payoff

You will owe $764,719 at the end of 2013. Your property, if cap rates do rise to 14%, will be worth about $1,270,000. Recall that your lender required a Loan-to-Value Ratio of 75% when you applied for the loan. Will it be time to reach for the antacids?

Loan-to-Value Ratio = Loan Amount / Property’s Appraised Amount
Loan-to-Value Ratio at EOY 2013 = 764,719 / 1,270,000
Loan-to-Value Ratio at EOY 2013 = 60.2%

Your LTV looks even better at EOY 2013 than it did when you originally applied for the loan. It’s time to find a polite way to tell the lender to stop looking for excuses. Your loan request is solid and needs to be approved.

You’ve assembled a good deal of data to support your loan request, but don’t forget that a major part of your objective here is to present it in the most effective way. Start by trying to boil it all down. Simplify and summarize. Think of this part of the process as the real estate equivalent of the “elevator pitch.” Ultimately you’re going to need to provide the loan officer with every detail, but you may not get a chance to tell the whole story unless you can convey the essentials in the time it takes to ride the elevator. You need an executive summary.

sample executive summary

This report gives a very direct one-page summary of basic information about the property and its financial metrics. Your lender can see immediately the amount of the loan you’re looking for, the LTV and Debt Coverage Ratio, the Net Operating Income and the cash flow. This report doesn’t supply the underlying supporting data to justify these numbers — that’s why it’s a summary — but taken at face value it tells the loan officer whether there is any reason to give your request a serious look.

An alternative is a report we call the “Real Estate Business Plan,” and it too looks very different from the rows and columns of numbers usually associated with a pro forma. You might assemble information into a report like this in a situation where you still want to make your initial approach with what is essentially still an overview of the property, but one that provides a bit more detail than the one-page summary. Just as with the Executive Summary, you want to provide enough information to be effective, but not so much that you discourage the recipient from actually reading the document.

We designed this report to focus on property description, sources and uses of funds, financing, cash flows, and rates of return, and to simplify its presentation by displaying only the data that is pertinent to the holding period you specify. So, even though the software can deliver projections of up to 20 years, if you want a report based on a five-year holding period, you get a nice, clean presentation with no extraneous labels or data, as you see in this excerpt:

sample business plan, part 1


sample business plan, part 2


sample business plan, part 3


At the beginning of our discussion of pro formas and presentations, I said that you needed to deliver a package that is easy to grasp but also provides enough detail to support your evaluation of the property and your request for financing. You may have already inferred from the progress of this article that the process of building the presentation runs in a direction that’s essentially opposite from the process of delivery. You need to begin, as we did here, at the most granular level of detail: defining individual unit rents and item-by-item operating expenses, first as they currently exist, then as you project them to grow.

That is why you built your rent roll first, then your extended APOD, then your cash flow projections. Next, you distilled this information into summary formats — the Executive Summary and the Real Estate Business Plan.

You built your case by going from the specific to the general. You’ll typically present your case for financing, however, by going the other way. You start with the Summary or Business Plan type of report, which provides enough information to introduce your request without burying the loan officer in a mountain of tiny numbers. When that loan officer says, “Where did you get these revenue projections?” you’ve got your rent roll. When she says, “How did you come up with this NOI?” you’ve got your APOD. And you can do the same for your cash flow and debt coverage, and resale value and rates of return, and more.

You’ve got it all covered.

Before we conclude this discussion, a brief reality check is in order. The example we just worked through was a happy case study because the property’s income stream justified the financing you sought. All the number crunching in the world, however, won’t transform a troubled investment into a good one. A detailed analysis can, however, still be helpful because it can show you what level of revenue you need to reach, or what level of cost-cutting you have to achieve to bring the property into positive cash flow territory and get it back on its feet. But whatever you do, don’t try to “enhance” the numbers to make the property look good. You’re not going to fool the lender and there’s not much point in fooling yourself.

So, what did you learn in Part 2 of this article? You learned to build a rent roll, one style for residential units and another for commercial. You learned to develop pro forma projections by extending your current-year estimates of revenue, operating expenses, and cash flows into the future. Perhaps most important, you learned about creating presentations out of those pro forma projections — presentations that are readable and effective, and that can help you make you case for financing your investment property.

Copyright 2009, RealData® Inc. All Rights Reserved
The information presented in this article represents the opinions of the author and does not necessarily reflect the opinions of RealData® Inc. The material contained in articles that appear on realdata.com is not intended to provide  legal, tax or other professional advice or to substitute for proper professional advice and/or due diligence. We urge you to consult an attorney, CPA or other appropriate professional before taking any action in regard to matters discussed in any article or posting. The posting of any article and of any link back to the author and/or the author’s company does not constitute an endorsement or recommendation of the author’s products or services.
You may not reproduce, distribute, or transmit any of the materials at this site without the express written permission of RealData® Inc. or other copyright holders. The content of web sites displayed or linked from the realdata.com is the copyrighted material of those respective sites.

Making the Case for Your Commercial Refinance, Part 1

Since we released the original version of our Real Estate Investment Analysis software in 1982, our focus has been on pro forma financial analysis of real estate investments and of development properties – projecting the numbers out over time to help users gain a sense of what kind of investment performance they might expect from a particular property or project.

And for lo, these many years, our customers (and from time to time, we ourselves) have used the software to help make decisions as to whether or not to buy a property, and at what price and on what terms. Customers have used it to model how things might play out in the worst case, or in the best case, or somewhere in between. They have used it also to compare alternative investment opportunities.

This type of decision-making process has by far been the most common use of our software. More and more, however, we’ve seen an increased use of these pro formas for the purpose of making presentations to potential equity partners and to lenders.

Which brings us at last to the point of this article. When the economy is blazing away at warp speed, everything is – or at least seems – a bit easier. Forecasts are easier to meet, and partners and lenders are easier to find. But sometimes the economy is not so good, and presents us with new challenges. At this writing, we find ourselves in the middle of a bad case of credit lockjaw. Nothing lasts forever (which in this instance is a good thing), so eventually our credit markets and overall economy will rediscover their equilibrium.

This is all fine, unless you’re holding a property today with a mortgage that will balloon in the near future. In that case, you need to find a new loan, and you’re probably going to have to work for it. That means doing some homework, understanding the process, and building the most compelling case you can for approval of that new loan.

If you were trying to refinance your home, you would be dealing with recent sales of comparable houses, your personal income and debt, and your credit score. With the possible exception of working to get your credit report in order, there’s not a great deal you would do personally to build a case for your re-fi. With an income property, however, a carefully prepared presentation can go a long way in helping you convince a lender – or even a new equity partner – that you have a viable investment.

Re-enter your friend, the pro forma analysis. You may have thought he was on vacation until sales of real estate revived, but in fact he’s as busy as ever with financing and partnerships. If the numbers do indeed work for a property whose balloon is coming due – and sorry, don’t expect to transform a bad investment into a good one with just a pile of color charts – then a detailed pro forma may be that property’s best friend.

Don’t even think about starting that pro forma until you’ve done a bit of legwork and preparation. First you’re going to need some information that is external to the property itself. You need to know the prevailing market capitalization rate for properties of the same type as yours (i.e., office, retail, apartment, industrial, etc.) and in the same market. This information will be critical to estimating the current value of the property. Perhaps the best place to seek this information is from a local commercial appraiser. The bank will certainly use an appraiser, and the appraiser will certainly use a cap rate, so don’t get left out of the party. For the sake of the example we’re going to construct here, say that the commercial appraiser tells you the prevailing cap rate for properties like yours in your market is 11%.

Next you need to learn about underwriting criteria from your potential lenders. Specifically, you need to know the probable interest rate and term of the new loan; the lender’s maximum Loan-to-Value Ratio; and the lender’s minimum required Debt Coverage Ratio. Don’t assume that these criteria will be identical across all lenders or across all property types. In fact, they probably will not. It should not surprise you that different lenders quote different interest rates, but you must also recognize that the same lender may be willing to lend 80% of the value of an apartment complex, but only 65% of the value of a shopping center. Know the lender’s terms before you ask for the loan.

For the purpose of this example, let’s say you’ve called your current lender and found that their maximum Loan-to-Value Ratio for a property like yours is 75%. They require a Debt Coverage Ratio of at least 1.20, and if all looks good, they will loan at 7.75% for 15 years.

We’ll discuss these criteria in detail in a moment, but for now let’s stay focused on collecting information, this time about the property itself. You need to assemble the amount of actual current rent income from each unit and identify the market rent of currently vacant units. You need to make realistic estimates of rental income for the next several years, taking into account the terms of leases now in place. You must figure your current year’s operating expenses, keeping in mind that certain expenditures such as debt payments, capital improvements and commissions should not be included. Nor should you include depreciation or amortization of loan points, which are deductions but not operating expenses. Once again, you have to make some realistic estimates as to how these expenses may change over the next several years. Finally, of course, you have to learn the balance of your current mortgage, so you’ll know how much of a re-fi you require.

Let’s return now to the underwriting criteria you identified, and start with the Loan-to-Value Ratio (LTV):

Loan-to-Value Ratio = Loan Amount / Lesser of Property’s Appraised Amount or Actual Selling Price

If this is a re-fi, then there is no “selling price,” so the value here will be the amount for which the property is appraised. If your financial institution has not taken leave of its senses (in general, if it has not appeared in the headlines or before a Congressional subcommittee in the last six months), then it should be reluctant to loan you or anyone else 100% of the value of a property. They expect you to have some skin in the game, and the question is merely how much.

The lender will quote you their maximum LTV, and before you get anywhere near an application form, you are going to perform your own calculation with your particular property. How much of a loan do you need to replace the existing financing, and how does that relate to the current value of the property?

It should be clear enough that the lower your actual LTV, the more likely you are to secure the loan. The lower the LTV, the more you, the borrower have to lose and the less likely you are to walk away. A low LTV may even earn you more favorable terms. You know how much of a loan you need, so to determine the LTV of your proposed loan, you must estimate the value of the property. Find that value with the same method the lender’s appraiser is likely to use: by applying a capitalization rate to the Net Operating Income (NOI). You already called around to find the prevailing market cap rate, so now you need to calculate the NOI. The most direct way to do this is with the venerable APOD form, where you list your annual income and expenses:

sample APOD for commercial refinance

The total of your scheduled rent income for this year should be $219,600, but because of vacancy and credit losses you will actually collect $210,816. Your various operating expenses total $51,050, leaving you a Net Operating Income of $159,766.

Remember that an appraiser told you the prevailing cap rate for this type of property in your market area is 11%. You have what you need to estimate the value of the property:

Value = Net Operating Income / Capitalization Rate
Value = 159,766 / 0.11
Value = 1,452,418

Round that off to $1.45 million.

You’re ready now to perform your first underwriting calculation. Recall that your lender’s maximum Loan-to-Value Ratio is 75%. Your current loan – the one that is about to balloon – has a balance of $975,000.

Loan-to-Value Ratio = Loan Amount / Lesser of Property’s Appraised Amount or Actual Selling Price
Loan-to-Value Ratio = 975,000 / 1,450,000
Loan-to-Value Ratio = 67.2%

Assuming the lender’s appraiser agrees with your estimate of value, you’ve cleared your first hurdle. Being a cautious individual, however, you want to know your worst-case scenario. What is the lowest appraisal that would still allow your $975,000 re-fi to meet the lender’s LTV requirement? Simply transpose the formula to solve for a different variable:

Property’s Appraised Amount = Loan Amount / Loan-to-Value Ratio
Property’s Appraised Amount = 975,000 / 0.75
Property’s Appraised Amount = 1,300.000

Any appraisal over $1.3 million will be good enough to satisfy the 75% Loan-to-Value requirement.

You will want to build a pro forma that goes out a least five years, so you can demonstrate to the lender that your anticipated cash flow and debt coverage are solid and likely to stay that way. Before you do so, however, there is a formula you can use that will give you a quick estimate of the maximum loan amount that the property’s current income can support. Remember that the strength of an income property lies in the strength of its income stream. This is how the lender will look at your proposal, so it’s what you need to do as well. Here is the formula:

Maximum Loan Amount = Net Operating Income / Minimum Debt Coverage Ratio / (Monthly Mortgage Constant x 12)

You know that your Net Operating Income is $159,766, and the lender has told you the Minimum Debt Coverage Ratio is 1.20. But what’s this Monthly Mortgage Constant?

A mortgage constant is the periodic payment amount on a loan of $1 at a particular interest rate and term. If you know the constant for a loan of $1, you can multiply it by the actual number of dollars of the loan to find the payment amount.

Readers of my books have access to a web site with a variety of tools, including a table of mortgage constants. You can also calculate the Mortgage Constant using this formula in Microsoft Excel:

=PMT(Periodic Rate, Number of Periods, -1)

In the Excel formula, the amount of the loan must be entered as a negative number. In the case of a mortgage constant, we want to use a loan of $1, hence the -1. In the case of a loan at 7.75% for 15 years, the formula would look like this:

=PMT(0.0775/12, 180, -1) = 0.00941276

Since this loan is going to be paid monthly, you express both the rate and the number of periods as monthly amount. Format your answer to display at least eight decimal places.

Now you have all the elements to plug into the formula for maximum loan amount: the Net Operating Income, the minimum Debt Coverage Ratio, and the Mortgage Constant.

Maximum Loan Amount = Net Operating Income / Minimum Debt Coverage Ratio / (Monthly Mortgage Constant x 12)
Maximum Loan Amount = 159,766 / 1.20/ (0.00941276 x 12) Maximum Loan Amount = 133,138.33 / (0.00941276 x 12)
Maximum Loan Amount = 133,138.33 / 0.11295312 Maximum Loan Amount = 1,178,704

Keep in mind that rounding could alter your answer by a few dollars.

(An aside: If you’re the sort of person who does not like to play with long formulas, or who tends to tap calculator keys with a closed fist, we have a solution for you. The RealData Real Estate Calculator – Deluxe Edition, will do all of these underwriting calculations for you, as well as perform a host of other useful real estate functions, including amortization schedules for loans with a variety of terms. There are sixteen modules in the Calculator. Find more info at http://realdata.com/p/calculator.)

Your lender will surely round this result, probably down to something like $1.175 million. But you’re looking for just $975,000, so it appears that your income stream will support this loan request. You will want to verify this by calculating the property’s Debt Coverage Ratio going out five or more years. You’ll do that as part of your property pro forma, in the next installment of this article.

Up to this point, however, you’ve accomplished quite a bit: You learned what information you need to assemble about your lender’s underwriting process, about your property’s income, expenses and loan balance, and about the prevailing cap rate in your market. You’ve learned to use some of that information to estimate the current value of the property, then taken that result to determine if the property will likely satisfy the lender’s Loan-to-Value requirement.

You’ve learned about another underwriting metric, Debt Coverage Ratio, and about mortgage constants. You’ve seen how to combine those to test your property’s income stream to see if it’s strong enough to support your loan request.

Not bad for an hour or two of work.

Next time you’ll see how to assemble this information and more into the kind of professional presentation you can give to a potential lender or equity partner.

Copyright 2009, RealData® Inc. All Rights Reserved

The information presented in this article represents the opinions of the author and does not necessarily reflect the opinions of RealData® Inc. The material contained in articles that appear on realdata.com is not intended to provide  legal, tax or other professional advice or to substitute for proper professional advice and/or due diligence. We urge you to consult an attorney, CPA or other appropriate professional before taking any action in regard to matters discussed in any article or posting. The posting of any article and of any link back to the author and/or the author’s company does not constitute an endorsement or recommendation of the author’s products or services.
You may not reproduce, distribute, or transmit any of the materials at this site without the express written permission of RealData® Inc. or other copyright holders. The content of web sites displayed or linked from the realdata.com is the copyrighted material of those respective sites.

Cash Flow Analysis — Annual or Monthly?

A reader of one of my books wrote to me recently with a very worthwhile question.  When we build a pro-forma analysis of future cash flows from a real estate investment, why do we annualize those cash flows instead dealing with them on a monthly basis?  After all, rent is typically collected and bills paid monthly.

The quick and facile answer, of course, is because we’ve always done it that way. Back in the day, we didn’t have powerful personal computers and sophisticated real estate software, so one might argue that this annual approach is just a holdover from a golden age that has passed us by.

Then again, there may be some wisdom inherent in this approach. To make monthly estimates of future cash flows requires monthly, rather than annual, estimates of income, expenses and debt service. The task is not impossible, but collecting, organizing, and deploying this amount of data will surely take much greater time and effort, presumably up to twelve times as much. And we all know that time is money.

Is it practical to do this, and if so, is it worth the effort?  It’s important to keep in mind that you’re not performing an accounting function but rather making projections about what’s going to happen in the future. It’s often difficult enough to estimate your annual cost for heating fuel or electricity five years hence. Trying to estimate such costs by the month can be even more problematic and time-consuming.

Assuming that someone else hasn’t already closed on this property while you were playing Hamlet, did you in fact gain any additional insight or advantage as a reward for your extra effort?

A monthly projection of future cash flows substantially increases your “degrees of freedom” in making estimates, so the monthly estimates are not only more difficult to make, but they also provide you with many more opportunities to be wrong. To put it another way, you are just as likely to introduce errors in timing as you are to add precision, thus offsetting at least some if not all of the benefit of your considerable extra effort.

Having said all this, it is also true that a dramatic skewing of cash flow toward the beginning of a year could make a noticeable difference in a particular discounted cash flow calculation. One might feel that is justified to handle such an atypical income stream differently.

For what it’s worth, my opinion is that the conventional wisdom here actually makes sense. Forecasting the future is an imperfect art; in most situations, annualizing the net cash flow is a reasonable compromise with reality and a task of more manageable proportions.

Frank Gallinelli


Excel 2007 – New File Types, Macro Security and Other Mysteries

When Microsoft released Excel 2007 it deployed some of the most extensive changes to the product in many years.  It introduced an entirely new user interface, a new menu format called the “Ribbon,” enhanced security, and an entirely new data structure for its files.  With this new data structure came an array of new file types.

Many of these changes have implications that are not always obvious to the user and, from our point of view at least, are not always entirely welcome.

This will be the first of what may be several posts on the RealData blog where we try to address what we feel are some of critical changes you need to know about in Excel 2007 so that you can use it successfully.  We’re writing these posts with users of RealData software in mind – particularly users of our more sophisticated Excel-based products like “Real Estate Investment Analysis,” “On Schedule” and “Commercial/Industrial Development” – but we feel strongly that it’s information all Excel users should have.

So – let’s begin with by comparing the file types in the old Excel vs. the new Excel.

How Things Were:  Two Key Facts to Remember

  1. If you have used earlier versions of Excel, you probably know that you used workbooks, called .xls files – and templates, called .xlt files.  Workbooks are collections of worksheets, sometimes accompanied by built-in programming code called “macros.”  Templates are a special kind of workbook.  When you launch a template, it leaves the original unchanged and presents you with a new workbook file based on that template.  That way you don’t accidentally overwrite the original.
  2. If you used RealData software, or perhaps certain other commercial Excel-based applications, the Excel file included hidden macro code.  You never saw it, but you know it was there because Excel would ask you if you wanted to enable the macros. Such code is typically essential for the functioning of a complex Excel-based program.  For example, our “Real Estate Investment Analysis” uses more than 12,000 lines of such code to provide menus, format reports, add/delete data records, and so on – functions that can’t be accomplished with simple spreadsheet formulas.  If you lose the code, the program will no longer function properly.

How Things Are: The New File Formats and How They’re Different

New to Excel 2007 are the .xlsx, .xlsb and .xlsm formats which Excel refers to as “Excel Workbook,” “Excel Binary Workbook” and “Excel Macro-Enabled Workbook,” respectively.  It’s important to understand the differences among these file types, and which can be used with RealData software products.

Each of these new formats is based on what Microsoft calls an “Open XML File Format.”  Without getting more technical than we need to here, the short version is that one can openly view and read the data from these files and convert them to other formats if necessary.  This ability is part of a trend toward an open and universal standard for documents so that data is not tied to a particular proprietary software product or company.

If you used earlier versions of Excel, then you know you customarily saved your workbook as a .xls file.  Let’s look at each of the new file formats and compare them to that original .xls Excel file format:

1. The .xlsx format is a lot like the old .xls format, but with one key difference:  It intentionally does not support macro code and will remove any macro code from a file that contains it. Remember what we said about RealData software and other products that rely on macros to provide their advanced functionality?  Right.  Without the macros these programs won’t work.  If you open a macro-driven .xls file and save it in the new Excel .xlsx format, the macros will be deleted and the program will no longer work as expected.

Fortunately, if you do try to save a file in this format, you will receive a warning message before the macro code is deleted:

Keep in mind that macros can be used by malefactors to deliver viruses. If you download an Excel file from some source other than a trusted commercial vendor, you run a risk as you would downloading a file from any unfamiliar source.  You’ll want to keep the macro code in a program from a trusted source like RealData, but you should be wary of any file containing macros if it comes from a source with which you’re not familiar and confident.

If you want to be certain to keep the macros intact in your RealData program, the simplest and most certain solution is this: Click “No” and return to the “Save” dialog.  Where you see a pulldown that says “Save as type,” choose “Excel 97-2003 Workbook (.xls).”

2. In contrast, the .xlsb and .xlsm formats do support macro code.  The .xlsb file is a streamlined format intended to speed up the process of opening and saving the file.  Like the .xlsm format, it can save an equivalent Excel workbook in a significantly smaller file size than the traditional .xls format.  The information in each of the cells is saved as plain text (you could view the information in Notepad if you wanted to) but the  macro code is encrypted.

Is it all right for you to save your RealData program as a .xlsb or .xlsm file and save some disk space?  The answer is a resounding maybe.

To re-open one of these files once you’ve saved it as .xlsb or .xlsm, Microsoft requires that you have installed on your computer an antivirus product capable of scanning and reviewing encrypted macro code before the file opens.  If this scan process does not happen, then the macros will be disabled in your software.  If you’re alert, you’ll  know this is so because of an inconspicuous warning message that appears in a horizontal bar above the Excel work area:

Click on “Options” and you should see something like this:

The default choice is “Help protect me….”  If you are confident that this file came from a trusted source, you can choose “Enable this content.”  If the file has a security certificate attached, the details of that certificate will be displayed and you can choose “Trust all documents from this publisher.”  RealData does have a security certificate attached to its program files.

Unfortunately, not all antivirus software is able to scan encrypted macro code. From our own experience we can confirm that Version 8.0 of the AVG  product appears to work without problems ( http://www.avg.com).

If you were getting ready to breathe a sigh of relief, hold it.  What we describe above is how .xlsb and .xlsm are supposed to behave.  Some users, however, have reported to us that, if they see the “macros disabled” message and click the options button, they get only one choice, and it’s not the one they want:

Why does this happen sometimes, but not always?  If we could answer questions like that, we’d be so famous you wouldn’t even be able to talk to us.  Seriously.

Which brings us back to bullet-point #1, worth repeating;

If you want to be certain to keep the macros intact in your RealData program, the simplest and most certain solution is this: Click “No” and return to the “Save” dialog.  Where you see a pulldown that says “Save as type,” choose “Excel 97-2003 Workbook (.xls).”

This should be your choice if you want your analysis to be compatible with both Excel 2007 and other computers which may have an earlier version of Excel installed on them.  RealData software products automatically detect if you are using Excel 2007 and set the default file type to be .xls, although you can override this if you so choose.

The Short Version

  1. RealData delivers its macro-powered programs using the Excel 97-2003 file format, i.e., .xls. If you always save your work in that format, you should have no problems with Excel 2007 opening or running the macros in RealData programs.
  2. If you save a file in .xlsx format, Excel will strip out all of the macro code and that particular RealData file will no longer function properly.
  3. If you save in .xlsb or .xlsm format, then when you re-open the file, Excel will be looking for antivirus software to scan the encrypted macros.  If it doesn’t find it, you will have to instruct Excel to open this content; some users have reported being unable to do so.


Excel Template Formats

As mentioned above, RealData delivers it programs as template (.xlt) files. When you launch a template, it leaves the original unchanged and presents you with a new workbook file based on that template.  That way you don’t accidentally overwrite the original.

Excel 2007 contains two new template file formats, so now there are three flavors:

  1. .xltx called “Excel Template”
  2. .xltm called “Excel Macro-Enabled Template”
  3. .xlt called “Excel 97-2003 Template”

RealData software is currently distributed in .xlt format.  You could convert this file to .xltm and it should work fine on your computer, assuming that you have anti-virus software capable of scanning encrypted macros.

But why tempt fate for no reason? We recommend that you stick with the .xlt format.

Excel 2007 File Icons

Each of the file formats has its own icon.  As you can see from the image below, these icons are very similar in appearance.  The template file types share a common horizontal yellow bar across the top edge.  You may find these images helpful when you try to recognize different Excel file types by their icons.

Stayed tuned to our blog for more about Excel 2007.

realdata.com


New investment analysis service — and data form

If you subscribe to our e-newsletter, the RealData Dispatch, then you know that we just launched a new service where we will run a property analysis for you, using your data and our software.

All you do is download a questionnaire, fill it in with the particulars about the property you want to evaluate, and email it or fax it back to us. We’ll run your information through the Standard Edition of “Real Estate Investment Analysis” and send the reports back via email.

You can get more details here.

Even if you don’t plan to use the service right now, I’d like to suggest that you download the form. I think you’ll find it to be a helpful guide for collecting data whenever you need to do an investment analysis, whether you’re working with our software or scribbling on the back of an envelope.

And speaking of our newsletter, just one more comment. If you subscribed but haven’t been receiving it, then it’s probably getting stuck in your spam box. It seems to me that spam filters have been getting more aggressive. I know it’s necessary to fight the growing tide, but I’ve been finding more “real” mail getting swept away with the junk.

I would urge that you go to your email program or service and “whitelist” realdata.com. For example, if you’re using Yahoo mail, go to “Options” and add a filter that tells Yahoo to direct anything from realdata.com to your inbox. With Gmail, you go to “Settings” and do the same thing.

That way, our newsletter will reach you. In addition to providing announcements about our products, upgrades, etc., we use the newsletter to tell you when we have new educational content and when we’ve found an online resource that might be valuable to you as as an investor or developer.

If you aren’t already subscribed, you can do so using the form in the right sidebar >>.

Frank Gallinelli
realdata.com


Download sample chapters from my new book, “Mastering Real Estate Investment”

Hello All —

I thought you might like an opportunity to see some sample chapters from my new book, so I’m making two downloads available.

The first section of the book is devoted to 37 key formulas that every real estate investor should understand and know how to use.  One of the most important of these is capitalization rate. 
Chapter 10 discusses cap rate and gives you several examples that you can work through.

The second part of the book provides case studies where I take you step by step through different kinds of property investments.  In Chapter 38 I discuss using a single-family house as a rental property.  This download is a seven-page excerpt from the chapter, which continues with a thorough discussion of the single-family rental.

I hope you find these samples useful, and welcome your comments.

Frank Gallinelli
realdata.com


Is Now the Time To Buy Real Estate for Investment?

“Give me a one-armed economist!”  That’s what Harry Truman said as he grew weary of economic advisors who seemingly could never give a straight-out recommendation without adding, “…but on the other hand….”

I believe serious investors understand that they can succeed in both good economies and in bad. They also know that they may have to adjust their approach to fit the circumstances.   Has anyone seen Warren Buffet hiding under a rock?

Income-producing real estate – that is, rental properties – offer investors an excellent opportunity to build wealth over the long term.  It’s important to understand that the value of a typical income property doesn’t necessarily rise and fall in step with the home market.  Investment properties are bought and sold for their ability to produce net income.  So, if you buy a property at a sensible price relative to its income and you manage it well, you should enjoy a good return over the long term.

Everyone expects their investments to succeed in a hot market, but what about now, when the economy is struggling?  It’s not uncommon to see apartment properties do well at times like this.  When money is tight and it’s difficult for buyers to come up with down payments and to afford mortgage terms, demand for apartments typically rises.

Take a look at the medical office buildings in your market.  Health care doesn’t go out of fashion, and with boomers getting older, there’s a good chance that demand will rise.  Look also at university towns.  The turnover of students and faculty typically translates into high demand.

I’ll say more about these and perhaps some other areas of opportunity in future posts.

And finally, what about that one-armed economist?  Is there a, “…but on the other hand?”  As much as we would like every decision to be unambiguous, all investments involve risk.  Otherwise there would be no reward.  So what are the caution flags?

First, remember that all real estate is local.  Your local job market, for example, may be atypically strong, with new employers moving in; or especially weak, with important job sources shutting down.  View all generalities through the prism of your local market.

Remember that cash is king, especially in a weak economy.  It’s all right to try to acquire a property using as little of your own cash as possible (provided, of course, that the deal works on those terms).  But there’s a big difference between using very little cash and having very little cash.  If you have nothing in reserve to fall back on, the risk of a highly leveraged investment may be greater than you can deal with.

This may not be the time to buy with no cash and flip for a profit tomorrow, but it can be an excellent time to buy for the long term.  Do your homework, run the numbers, and prosper.


My latest: Mastering Real Estate Investment

I’m hoping that, by now, you’ve heard I have a new book out: “Mastering Real Estate Investment: Examples, Metrics and Case Studies.” It was released just a few weeks ago, and like any proud author I’m pleased to say it’s doing well.

And so…  what’s it’s all about?  An why did I think anyone would read it?

I’d probably describe it best as being two books in one.  Quite a few readers of my first book, “What Every Real Estate Investor Needs to Know About Cash Flow…,” told me they wanted to see more examples of the 37 key calculations I discussed there. That’s an entirely reasonable request; most of us learn better from examples.

So, I began with the idea of creating a workbook of sorts.  For each of my 37 metrics I created a series of sample problems that the reader could work through.  And, of course, I provided the step-by-solution for every problem.

I would humbly submit (all right, maybe not so humbly) that this was a good idea, because to master anything you have to roll up your sleeves and get involved with it.  You can’t just read about these concepts, you have to practice them if you expect to internalize them as part of your approach to investing.  And that, by the way, is how “Mastering” got into the title.

It’s one thing to master these concepts, but it’s yet another to understand how to integrate them and apply them — and that’s why I wrote the second part of the book, the case studies.  I took four different type of properties — a single-family rental, a development project, and apartment building, and a commercial property.

What I tried to do here was to take real-life situations, where you have to deal with asking prices that may be realistic or not; where you encounter seller representations that may be accurate or not; where you have to make judgments and forecasts using imperfect current knowledge.

One of my goals in this part of the book was to show you how to play, “What if…” with your forecasts so as to give you a sense of the range of possible outcomes for your investment if things like rent projections, interest rates, resale costs varied.  Also, in a departure from some of my usual topics, I tried to show how to look at a re-hab project — specifically, how to estimate an appropriate price for a property that you plan to re-develop into an income-producing investment.

Part 2 of the book can stand on its own, so if you’re comfortable with concepts like NOI, cap rate, discounted cash flow and IRR, go ahead an read this part first.

You’ll find more about this book, and my others, here.


Stirring the Alphabet Soup of Real Estate Investing, Part 1

UPDATE: I’ve re-written this multi-part blog post and it’s now available in a convenient “flip book,” readable in your browser:

5 Metrics Every Real Estate Investor Needs to Know


PV, NPV, DCF, PI, IRR–It may seem like a witch’s brew of random letters, but truly, it’s just real estate investing. You can handle it. Any or all of these measures can be useful to you, if you understand what they mean and when to use them.

NPV – Net Present Value

NPV, or Net Present Value, is connected to what all good real estate investors and appraisers do, namely discounted cash flow analysis (aka DCF, if you’d like some more initials).

Discounted Cash Flow is a pretty straightforward undertaking. You project the cash flows that you think your investment property will achieve over the next 5, 10, even 20 years. Then you pause to remind yourself that money received in the future is less valuable than money received in the present. So, you discount each of those future cash flows by a rate equal to the “opportunity cost” of your capital investment. The opportunity cost is the rate you might have earned on your money if you didn’t spend it to buy this particular property.

Consider this example, where you invest $300,000 in cash to earn the
following cash flows:

Year 1 Cash Flow:
10,000
Year 2 Cash Flow:
20,000
Year 3 Cash Flow:
25,000
Year 4 Cash Flow:
30,000
Year 5 Cash Flow:
385,000
(includes the proceeds of sale)

If you discount each of these cash flows at 10%, then add up their discounted values, you’ll get 303,948:

Year 1, Discounted:
9,091
Year 1, Discounted:
16,529
Year 1, Discounted:
18,783
Year 1, Discounted:
20,490
Year 1, Discounted:
239,055
Total PV of Cash Flows:
303,948

Now you have the Present Value of all the future cash flows. However, you also had a cash flow when you initially purchased the property (call that Day 1 or Year 0) – a cash outflow of $300,000, your initial investment. To get the Net Present Value, you find the difference between the discounted value of the future cash flows (303,948) and what you paid to get those cash flows (300,000).

NPV = PV of future Cash Flows less Initial Investment
NPV = 303,948 – 300,000 = 3,948

What does that mean to you as an investor? If the NPV is positive, it suggests that the investment may be a good one. That’s because a positive NPV means the property’s rate of return is greater than the rate you identified as your opportunity cost. The more positive it is in relation to the initial investment, the more inclined you’ll be to look favorably on this investment. Your result here is not stellar, but it is at least positive.

If the NPV is negative, the property returns at a rate that is less than your opportunity cost, so you should probably reject this investment and put your money elsewhere.

That’s all fine, to the extent that you’re confident about that discount rate, your opportunity rate. You estimated 10% in the example above. What if you adjust that estimate by one-half of one percent either way?

NPV @ 9.5%
= 10,284
NPV @ 10.0%
= 3,948
NPV @ 10.5%
= (2,244)

How about one full percent?

NPV @ 9.0%
= 16,789
NPV @ 10.0%
= 3,948
NPV @ 11.0%
= (8,238)

Clearly, the NPV here is very sensitive to changes in the discount rate. If you revise your thinking just slightly about the appropriate discount rate, then the conclusion you draw may likewise need to be revised. As little as a half-point difference could change your attitude from luke-warm to hot or cold. The prudent investor will test a range of reasonable discount rates to get a sense of the range of possible results.

While we’re beating up on NPV, let’s also note that it doesn’t do you much good if your goal is to compare alternative investments. To have some kind of meaningful comparison, you need at least to keep the holding period for both properties the same. But what if one property requires that $300,000 cash investment, but the alternative investment requires $400,000?

PI – Profitability Index

Fortunately, NPV has a cousin that can help you with that problem: Profitability Index. While the NPV is the difference between the Present Value of future cash flows and the amount you invested to acquire them, Profitability Index is the ratio. It doesn’t tell you the number of dollars; it tells you how big the return is in proportion to the size of the  investment.

So where the NPV in the example above was equal to 303,948 minus 300,000, the Profitability Index looks like this:

PI = 303,948 / 300,000 = 1.013

If, quite improbably, you expected exactly the same cash flows from the property that required a 400,000 investment, you would expect your Profitability Index to be much worse, and it is.

PI = 303,948 /400,000: = 0.760

A Profitability Index of exactly 1.00 means the same as an NPV of zero. You’re looking at two identical amounts, in one case divided by each other so they give a result of 1.00 and in the other case subtracted one from the other, equaling zero.

An Index greater than 1.00 is a good thing, the investment is expected to be profitable; an Index less than 1.00 is a loser. When you compare two investments, you expect the one with the greater Index to show the greater profit.

Learn more about real estate investing metrics in my free flipbook, 5 Metrics Every Real Estate Investor Needs to Know

—Frank Gallinelli

####

Your time and your investment capital are too valuable to risk on a do-it-yourself investment spreadsheet. For more than 30 years, RealData has provided the best and most reliable real estate investment software to help you make intelligent investment decisions and to create presentations you can confidently show to lenders, clients, and equity partners. Learn more at www.realdata.com.

Copyright 2008, 2014, 2017, 2021  Frank Gallinelli and RealData® Inc. All Rights Reserved

The information presented in this article represents the opinions of the author and does not necessarily reflect the opinions of RealData® Inc. The material contained in articles that appear on realdata.com is not intended to provide legal, tax or other professional advice or to substitute for proper professional advice and/or due diligence. We urge you to consult an attorney, CPA or other appropriate professional before taking any action in regard to matters discussed in any article or posting. The posting of any article and of any link back to the author and/or the author’s company does not constitute an endorsement or recommendation of the author’s products or services.


Start Evaluating Investment Properties Today

Get Free Demo