articles
How to Underwrite a Value-Add Retail Strip Center: A Case Study
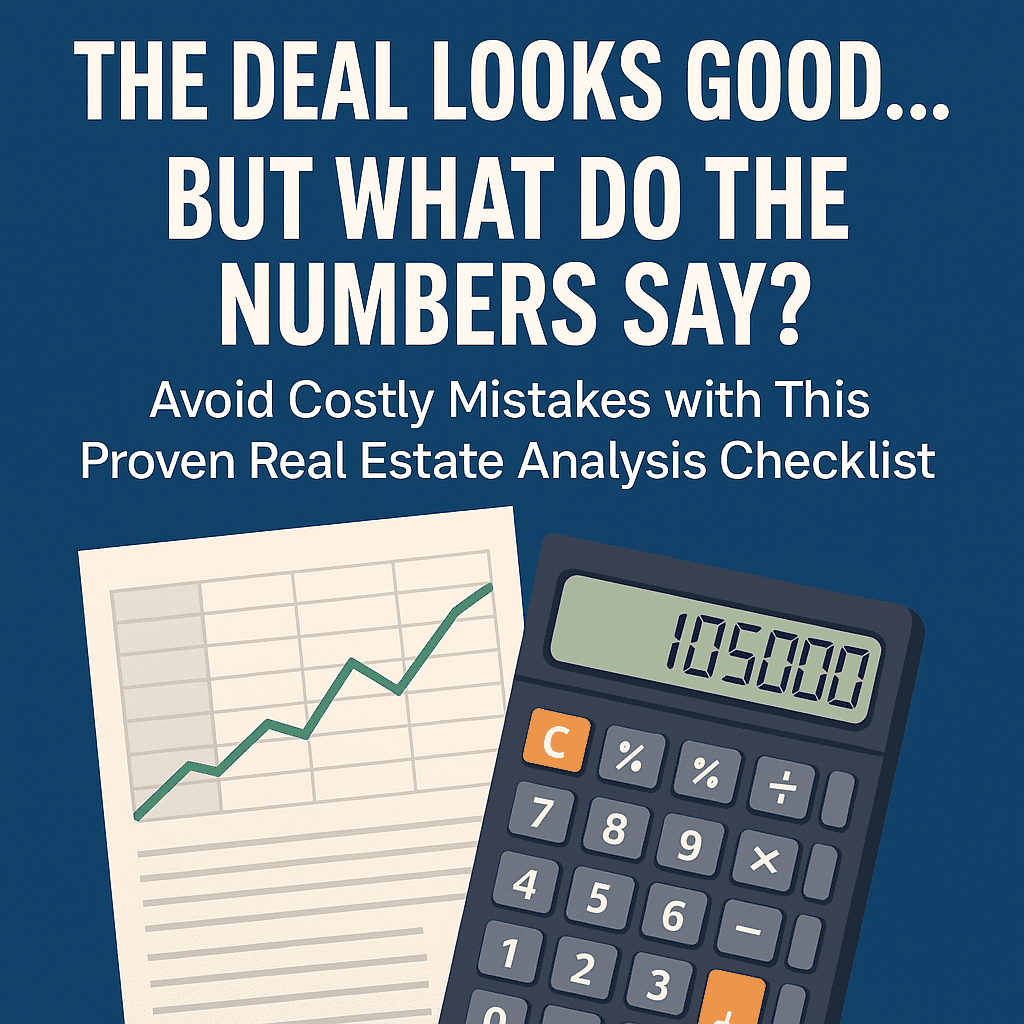
Here’s a deal like the ones I give my students to analyze — somewhat simplified, but the real analytical challenge is intact. Curious what you’d pay for this property and how you’d get there.
Fully occupied. Every tenant below market. Anchor lease expires in two years.
What’s your offer?