We’ve been hiding our bundles under a bushel! Find out more >>

800-899-6060

New Program from RealData: “REIA Quick Edition”


REIA Quick Edition is a compact a very affordable quick analysis of any income-producing property.

We designed it so you can key in just a few key items and get a single-page report that can help you to decide whether you should pass or examine the property in create detail. It will calculate your NOI, Cash-on-Cash, Debt Coverage Ratio, IRR, potential resale price and more.

Get more info at https://www.realdata.com/products/reia-quick


The Case of the Mysterious Sinking IRR

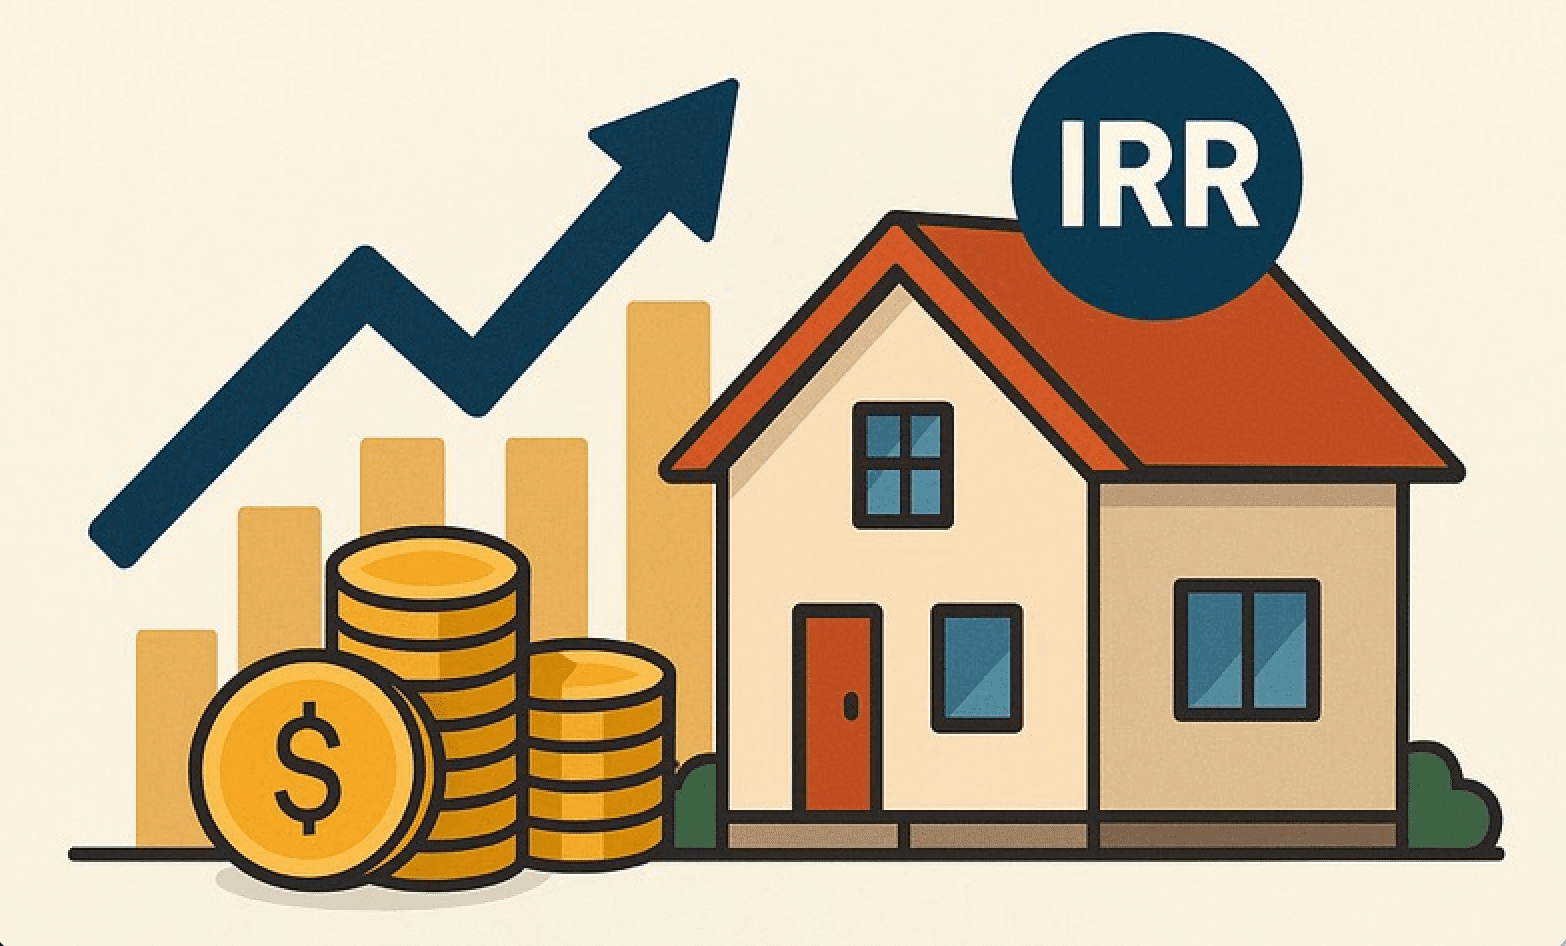
Users of our Real Estate Investment Analysis program sometimes call us with questions that are not about the software but about the underlying analysis. If we had a “greatest hits” list for those questions the all-time winner would be this: “My cash flow goes up each year; the value of the property goes up each year; but when I look at the Internal Rate of Return, it goes down almost every year. What’s up with that?” To see how this can happen, let’s take a look at two very simple examples.

Example #1: We purchase a property for $100,000 all cash. It has a Net Operating Income of $10,000, so the capitalization rate is 10%. We are going to assume that 10% is the right cap rate for this market (primarily because it make the math in our example easy to follow). Because we bought the property for cash there is no debt service and so we can also assume that the cash flow is the same as the Net Operating Income. For those who require an instant (and very abbreviated) refresher course on these concepts, use the following:

  • Gross Income less Operating Expenses equals Net Operating Income
  • Net Operating Income less Debt Service equals Cash Flow
  • Net Operating Income divided by Capitalization Rate equals the property’s Present Value

The property is in good shape and is running well when we buy it. Our initial cash flow occurs on Day One when we spend $100,000 in cash to make the purchase. We project that we can raise the rent 4% during the first year to $10,400. The property is well-located, so we believe we can get a bit more aggressive over time. We’ll project that we can increase the revenue 5% in the second year, 6% in the third, 7% in the fourth and 8% in the fifth. Here is what our projections look like:


Notice that, if we sell the property at the end of one year for its full value (i.e., with no selling costs, to keep matters simple), our Internal Rate of Return (IRR) is a pleasing 14.4%. If we sell at the end of year two, our IRR for that holding period is even better, 14.92%. If we hang on to the property for five years, we see that we can expect a 16.38% IRR. The rents go up each year, the value goes up and so does the IRR. All is right with the world.

Example #2: At the same time we buy another property, also for $100,000 cash. It too has a $10,000 NOI, but this property needs immediate management improvements to control expenses and to get rents in line with the market. We feel sure that we can get the NOI (and hence the cash flow) to $12,000 in the first year. That should get it on a stable footing, from which we expect a more modest 3% increase in rent each year thereafter. The rents go up each year, the value goes up each year, but what about the IRR?


At the end of the first year, we’re thrilled by a robust IRR of 32%. We worked hard; we deserve it. But if we hold the property for a second year the Internal Rate of Return drops to 22.76% — still not shabby but significantly lower than at the end of the prior year. Indeed, the longer we hold the property, the lower the IRR becomes. What, to coin a phrase, is wrong with this picture? Nothing is wrong, actually. The numbers are correct. Remember that Internal Rate of Return is a time-sensitive measurement. The biggest jump in cash flow and in the property’s value came early. The earlier it arrives, the less severely it gets discounted — it’s the “time value of money” concept. The increases that occur in years two through five are smaller to begin with and they get discounted over a greater number of years, shrinking their worth to us today even more.

Simply put, if we hold the property two years instead of one, then that second year dilutes the overall rate of return because it didn’t contribute as much (especially after an extra year of discounting) as the first year did. If we hold the property for three years, the return gets diluted still further.

At this point, someone in the back of the room is surely asking the insightful question, “So what?” Here’s what: The first property is telling us that it will perform better as an investment if we hold onto it for a while. Its rent increases are accelerating each year. Even though the increases have to be discounted — it’s that time value of money again — they’re growing at a pace that makes them worth waiting for. Hence the IRR gets higher with each year we hold on. The second property, however, has a bit more of a roman candle quality to its performance. The big flash comes early; after that, it just sputters along.

Does this mean you should immediately sell such a property? If you’re happy with the long-term IRR and could not find a replacement property with a greater yield, it might make sense to hold. Or you might be more comfortable following the words of immortal Janis Joplin: Get it while you can. To put that in more businesslike terms, you might decide to sell the property when the IRR peaks; then take the proceeds and reinvest them. Whichever way you go, the important thing is that you’ll be making an informed decision.

Better than being like this guy.


If you found this example helpful, I have a lot more educational material for real estate investors and developers. For example, check out these video lessons…

Real Estate Investment Case Studies where I take you step-by-step through the evaluation of five different property types: apartment, mixed-use, triple-net leased, retail strip center, and single-family property

Value-Add Real Estate Investments where I show how you might do something tangible or intangible to a property, but in either case, something that increases how much a person would pay to acquire that asset from you when you’re done.

Or if you’re ready for a complete training series in real estate investment, development, finance, partnerships, and more, consider Mastering Real Estate Investing.

—— Frank Gallinelli  


Copyright 2023,  Frank Gallinelli and RealData® Inc. All Rights Reserved

The information presented in this article represents the opinions of the author and does not necessarily reflect the opinions of RealData® Inc. The material contained in articles that appear on realdata.com is not intended to provide legal, tax or other professional advice or to substitute for proper professional advice and/or due diligence. We urge you to consult an attorney, CPA or other appropriate professional before taking any action in regard to matters discussed in any article or posting. The posting of any article and of any link back to the author and/or the author’s company does not constitute an endorsement or recommendation of the author’s products or services.


Love Your Hat! What is Your Lender Really Looking at When You Apply for a Commercial Mortgage?

If you’re not an all cash buyer, then when you purchase a piece of income-producing real estate you’ll probably need to secure mortgage financing to complete the deal. It’s essential for you to understand what your lender is looking at when underwriting that loan.

And — If you guessed that he or she is not admiring your millinery —  ok then, stick with me here. I’m going to discuss briefly a couple of key yardsticks.

Of course, this short video blog post is just the tip of the iceberg when it comes to evaluating, financing, and acquiring a successful real estate investment.

For in-depth insight into on all the key metrics and methods, check out https://realestateeducation.net/

And you’ll find the software that will do all the heavy lifting for your analysis and presentation at https://realdata.com


Copyright 2021,  Frank Gallinelli and RealData® Inc. All Rights Reserved

The information presented in this article represents the opinions of the author and does not necessarily reflect the opinions of RealData® Inc. The material contained in articles that appear on realdata.com is not intended to provide legal, tax or other professional advice or to substitute for proper professional advice and/or due diligence. We urge you to consult an attorney, CPA or other appropriate professional before taking any action in regard to matters discussed in any article or posting. The posting of any article and of any link back to the author and/or the author’s company does not constitute an endorsement or recommendation of the author’s products or services.


Video post: Understanding Net Operating Income, Part 2

In Part 1 this post, we looked at the revenue side of our NOI calculation. Now let’s look at the expense side, and how the end result – the NOI itself, is typically used when evaluating a potential real estate investment. Click the image below.


If you missed Part 1, you can watch it here.

Copyright 2021,  Frank Gallinelli and RealData® Inc. All Rights Reserved

The information presented in this article represents the opinions of the author and does not necessarily reflect the opinions of RealData® Inc. The material contained in articles that appear on realdata.com is not intended to provide legal, tax or other professional advice or to substitute for proper professional advice and/or due diligence. We urge you to consult an attorney, CPA or other appropriate professional before taking any action in regard to matters discussed in any article or posting. The posting of any article and of any link back to the author and/or the author’s company does not constitute an endorsement or recommendation of the author’s products or services.


Video post: Understanding Net Operating Income, Part 1

One topic that seems to generate a lot of interest and questions among investors I speak with is the subject of net operating income. Those who are new to real estate investing and even those with some experience are often unclear as to exactly what it is, what it means, and how to use it.

To shed some light on this topic, I’m going to try something new here – new for me at least – a video blog post. I’ll try to answer those questions by giving you a basic roadmap of how Net Operating Income is calculated, and how it’s used in real investment situations. So —  here we go with Part 1 of 2. Click the image below.

net operating income


Part 2 is now available here.


Copyright 2021,  Frank Gallinelli and RealData® Inc. All Rights Reserved

The information presented in this article represents the opinions of the author and does not necessarily reflect the opinions of RealData® Inc. The material contained in articles that appear on realdata.com is not intended to provide legal, tax or other professional advice or to substitute for proper professional advice and/or due diligence. We urge you to consult an attorney, CPA or other appropriate professional before taking any action in regard to matters discussed in any article or posting. The posting of any article and of any link back to the author and/or the author’s company does not constitute an endorsement or recommendation of the author’s products or services.


Real Estate Expense Recoveries—What are they, how do they work? (part 3)

In Part 2 of our discussion of real estate expense recoveries, we looked at several different methods that property owners use to recover some of their operating costs from tenants:

  • Simple pass-throughs — These typically work well in single-tenant properties, or in properties with no common area. The expenses chosen for reimbursement are billed to the single tenant; or if there are multiple tenants, then the charge is divided according to each tenant’s share of the total space.
  • Expense-stop pass-throughs — Some pass-through arrangements require the tenants to pay a just portion of the recoverable expenses. The landlord pays up to a certain amount, called an “expense stop,” and the rest is passed through to the tenants. The “stop” can be a dollar amount defined in the lease, or it can be a “base-year stop,” where the landlord pays whatever amount comes due in the first year of the lease and the tenants pay any increase in subsequent years.
  • CAM — In larger properties, where there is common space for the benefit of all tenants as well as for the public, the landlord my collect CAM (Common Area Maintenance) charges—expenses related to the maintenance of these common areas.

We left off at sticking point, however, regarding larger properties. If there is a significant amount common area, then the landlord will surely be thinking about the fact that this space accrues to the benefit of the tenants but doesn’t earn anything for the landlord. There must be a way to remedy this apparent inequity.


The Load Factor

Enter the “load factor.”

Fotolia_42618982_XSload factor

Recall two definitions near the end of the previous article:

usable square feet (usf): The amount of space physically occupied by a tenant.

rentable square feet (rsf): The amount of space on which the tenant pays rent.

The load factor represents a percentage of the common area, which is then added onto a tenant’s usable square footage to determine the tenant’s rentable square footage.

Let’s say a shopping center has a total area of 100,000 square feet. 90,000 is the usable area, occupied by tenants, and 10,000 is common area.

Load Factor = total area / usable area

Load Factor = 100,000 / 90,000

Load Factor = 1.11

What this means is that each tenant’s usable square footage will be multiplied by 1.11—in other words, bumped up by 11%—to determine its rentable square footage, the amount on which it pays rent.

Say for example that you operate a 2,000 square foot boutique in this 100,000 center, and have contracted to pay $40 per rentable square foot.

2,000 usable sf x 1.11 load factor = 2,220 rentable sf

2,220 rsf x $40 = $88,800 per year rent

Unlike what you did in the earlier pass-through models, you’re not paying an additional charge on top of your base rent here. Your base rental rate remains the same, but now it is applied to a greater number of square feet—the space you actually occupy plus a proportional share of the common area. This combination of your private space plus a pro-rata portion of the common space is what we now call your rentable square feet.

You and the other tenants are paying rent for your proportional shares of the common area from which you all benefit, and the landlord is receiving rent for all the space in the property. Cosmic equilibrium is restored.


Is It More Income or Less Expense?

Regardless of the name we give it—reimbursement, recovery, or pass-through—the end result is the same. The bottom line of our Annual Property Operating Data (APOD) form, Net Operating Income, is increased. The final issue to confront is how do we account for this additional money when we assemble a presentation or analysis?

more lessOne way that I see often, and which I believe to be incorrect, is to treat the reimbursement as if it were a negative expense—in other words, to show the expense reduced by the amount reimbursed. For example, if the actual property tax bill were $10,000 and the amount reimbursed were $9,000, then by this method the property tax expense would be shown as $1,000. Why do I say this is incorrect?

The purpose of an APOD, or of any income-and-expense statement, is to convey information that is both accurate and useful. The taxes for this property are $10,000. If you were a broker or property owner and handed me a report that showed taxes of $1,000, I would…

a) suspect you were trying to con me

b) doubt all of the rest of the numbers on your report

c) be denied essential information I need to evaluate the property (e.g., the true cost of property taxes and the lease terms regarding expense reimbursement)

d) find another broker or owner to work with

e) all of the above

The correct answer, of course, is “e.” You’ve missed a key ingredient of successful business discourse: clarity. You should convey your analysis of a property in terms that are unambiguous, accurate, and relevant to your audience.

If you don’t treat the reimbursement as a negative expense, then how should you handle it?

You should treat it as revenue, the same as rent.

  • It is rent. The amount may be based on a calculation involving one or more operating expenses, but it is still money paid by a tenant to a landlord under a lease agreement. If it walks like a duck, etc.
  • Many lease agreements will in fact describe the reimbursement as additional rent.
  • You can then apply a vacancy allowance to the total of base rent plus recoveries to account for the loss of both from a vacant unit. The top portion of your APOD might look like this:

(One side note on the interplay of vacancy on expense recoveries: Some leases will contain a gross-up clause. In such a lease, if there is less than full occupancy (which is defined in the lease, and is often pegged at 90 or 95%), then the landlord may take certain variable expenses that would be directly affected by the level of occupancy, such as janitorial cost, and “gross them up” to the amount they would be at full occupancy.)

In these three articles I’ve given you the abridged version of simple, single-tenant pass-throughs; pro-rated multi-tenant pass-throughs; expense stops; base-year stops; CAM charges; load factors; and even presentation issues. But there is no limit to the creativity of landlords and tenants in their pursuit of successful dealmaking. If you’ve been part of novel expense-recovery design, please share it with us.

—-Frank Gallinelli

Want to learn more? Visit learn.realdata.com

####

Your time and your investment capital are too valuable to risk on a do-it-yourself investment spreadsheet. For more than 30 years, RealData has provided the best and most reliable real estate investment software to help you make intelligent investment decisions and to create presentations you can confidently show to lenders, clients, and equity partners. Find out more at www.realdata.com.

Copyright 2016-2023,  Frank Gallinelli and RealData® Inc. All Rights Reserved

The information presented in this article represents the opinions of the author and does not necessarily reflect the opinions of RealData® Inc. The material contained in articles that appear on realdata.com is not intended to provide legal, tax or other professional advice or to substitute for proper professional advice and/or due diligence. We urge you to consult an attorney, CPA or other appropriate professional before taking any action in regard to matters discussed in any article or posting. The posting of any article and of any link back to the author and/or the author’s company does not constitute an endorsement or recommendation of the author’s products or services.

How to Look at Reserves for Replacement When You Invest in Income-Property

It may sound like a nit-picking detail: Where and how do you account for “reserves for replacement” when you try to value – and evaluate – a potential income-property investment? Isn’t this something your accountant sorts out when it’s time to do your tax return? Not really, and how you choose to handle it may have a meaningful impact on your investment decision-making process.


What are “Reserves for Replacement?”

Nothing lasts forever. While that observation may seem to be better suited to a discourse in philosophy, it also has practical application in regard to your property. Think HVAC system, roof, paving, elevator, etc. The question is simply when, not if, these and similar items will wear out.

A prudent investor may wish to put money away for the eventual rainy day (again, the roof comes to mind) when he or she will have to incur a significant capital expense. That investor may plan to move a certain amount of the property’s cash flow into a reserve account each year. Also, a lender may require the buyer of a property to fund a reserve account at the time of acquisition, particularly if there is an obvious need for capital improvements in the near future.

Such an account may go by a variety of names, the most common being “reserves for replacement,” “funded reserves,” or “capex (i.e., capital expenditures) reserves.”


Where do “Reserves for Replacement” Fit into Your Property Analysis?

This apparently simple concept gets tricky when we raise the question, “Where do we put these reserves in our property’s financial analysis?” More specifically, should these reserves be a part of the Net Operating Income calculation, or do they belong below the NOI line? Let’s take a look at examples of these two scenarios.

reserves for replacement, after NOI

Now let’s move the reserves above the NOI line.

reserves for replacement, befeore NOI

The math here is pretty basic. Clearly, the NOI is lower in the second case because we are subtracting an extra item. Notice that the cash flow stays the same because the reserves are above the cash flow line in both cases.


Which Approach is Correct?

There is, for want of a better term, a standard approach to the handling capital reserves, although it may not be the preferred choice in every situation.

That approach, which you will find in most real estate finance texts (including mine), in the CCIM courses on commercial real estate, and in our Real Estate Investment Analysis software, is to put the reserves below the NOI – in other words, not to treat reserves as having any effect on the Net Operating Income.

This makes sense, I believe, for a number of reasons. First, NOI by definition is equal to revenue minus operating expenses, and it would be a stretch to classify reserves as an operating expense. Operating expenses are costs incurred in the day-to-day operation of a property, costs such as property taxes, insurance, and maintenance. Reserves don’t fit that description, and in fact would not be treated as a deductible expense on your taxes.

Perhaps even more telling is the fact that we expect the money spent on an expense to leave our possession and be delivered to a third party who is providing some product or service. Funds placed in reserve are not money spent, but rather funds taken out of one pocket and put into another. It is still our money, unspent.


What Difference Does It Make?

Why do we care about the NOI at all? One reason is that it is common to apply a capitalization rate to the NOI in order to estimate the property’s value at a given point in time. The formula is familiar to most investors:

Value = Net Operating Income / Cap Rate

Let’s assume that we’re going to use a 7% market capitalization rate and apply it to the NOI. If reserves are below the NOI line, as in the first example above, then this is what we get:

Value = 55,000 / 0.07

Value = 785,712

Now let’s move the reserves above the NOI line, as in the second example.

Value = 45,000 / 0.07

Value = 642,855

With this presumably non-standard approach, we have a lower NOI, and when we capitalize it at the same 7% our estimate of value drops to $642,855. Changing how we account for these reserves has reduced our estimate of value by a significant amount, $142,857.


Is Correct Always Right?

I invite you now to go out and get an appraisal on a piece of commercial property. Examine it, and there is a very good chance you will find the property’s NOI has been reduced by a reserves-for-replacement allowance. Haven’t these people read my books?

The reality, of course, is that diminishing the NOI by an allowance for reserves is a more conservative approach to valuation. Given the financial meltdown of 2008 and its connection to real estate lending, it is not at all surprising that lenders and appraisers prefer an abundance of caution. Constraining the NOI not only has the potential to reduce valuation, but also makes it more difficult to satisfy a lender’s required Debt Coverage Ratio. Recall the formula:

Debt Coverage Ratio = Net Operating Income / Annual Debt Service

In the first case, with a NOI of $55,000, the DCR would equal 1.41. In the second, it would equal 1.15. If the lender required a DCR no less than 1.25 (a fairly common benchmark), the property would qualify in the first case, but not in the second.

It is worth keeping in mind that the estimate of value that is achieved by capitalizing the NOI depends, of course, on the cap rate that is used. Typically it is the so-called “market cap rate,” i.e., the rate at which similar properties in the same market have sold. It is essential to know the source of this cap rate data. Has it been based on NOIs that incorporate an allowance for reserves, or on the more standard approach, where the NOI is independent of reserves?

Obviously, there has to be consistency. If one chooses to reduce the NOI by the reserves, then one must use a market cap rate that is based on that same approach. If the source of market cap rate data is the community of brokers handling commercial transactions, then the odds are strong that the NOI used to build that market data did not incorporate reserves. It is likely that the brokers were trained to put reserves below the NOI line; in addition, they would have little incentive to look for ways to diminish the NOI and hence the estimate of market value.


The Bottom Line – One Investor’s Opinion

What I have described as the standard approach – where reserves are not a part of NOI – has stood for a very long time, and I would be loath to discard it. Doing so would seem to unravel the basic concept that Net Operating Income equals revenue net of operating expenses. It would also leave unanswered the question of what happens to the money placed in reserves. If it wasn’t spent then it still belongs to us, so how do we account for it?

At the same time, it would be foolish to ignore the reality that capital expenditures are likely to occur in the future, whether for improvements, replacement of equipment, or leasing costs.

For investors, perhaps the resolution is to recognize that, unlike an appraiser, we are not strictly concerned with nailing down a market valuation at a single point in time. Our interests extend beyond the closing and so perhaps we should broaden our field of vision. We should be more focused on the long term, the entire expected holding period of our investment – how will it perform, and does the price we pay justify the overall return we achieve?

Rather than a simple cap rate calculation, we may be better served by a Discounted Cash Flow analysis, where we can view that longer term, taking into account our financing costs, our funding of reserves, our utilization of those funds when needed, and the eventual recovery of unused reserves upon sale of the property.

In short, as investors, we may want not just to ask, “What is the market value today, based on capitalized NOI?” but rather, “What price makes sense in order to achieve the kind of return over time that we’re seeking?”

How do you treat reserves when you evaluate an income-property investment?

—-Frank Gallinelli

####

Your time and your investment capital are too valuable to risk on a do-it-yourself investment spreadsheet. For more than 30 years, RealData has provided the best and most reliable real estate investment software to help you make intelligent investment decisions and to create presentations you can confidently show to lenders, clients, and equity partners. Learn more at www.realdata.com.

Copyright 2014,  Frank Gallinelli and RealData® Inc. All Rights Reserved

The information presented in this article represents the opinions of the author and does not necessarily reflect the opinions of RealData® Inc. The material contained in articles that appear on realdata.com is not intended to provide legal, tax or other professional advice or to substitute for proper professional advice and/or due diligence. We urge you to consult an attorney, CPA or other appropriate professional before taking any action in regard to matters discussed in any article or posting. The posting of any article and of any link back to the author and/or the author’s company does not constitute an endorsement or recommendation of the author’s products or services.

Podcast: “Learn the key principles to effectively analyzing and evaluating your real estate deals”

I had the pleasure of recording a podcast recently with real estate entrepreneur Kevin Bupp. We discussed what I feel are some of the key principles that every real estate investor ought to understand — and so, I invite you to listen to that podcast here.


Using Cap Rate to Estimate the Value of an Investment Property

In recent posts I’ve been revisiting some key real estate investment metrics. Last time I discussed the finer points of Net Operating Income, and that topic should serve as an appropriate run-up to the subject of capitalization rates (aka cap rates). What are they and how do you use them?

Income capitalization is the technique typically used by commercial appraisers, and is a part of the decision-making process for most real estate investors as well. I invite you to jog over to an article I’ve written on the subject:

Estimating the Value of a Real Estate Investment Using Cap Rate

In addition, you can download Chapter 10 of my book, Mastering Real Estate Investment, which discusses cap rates and gives you several examples you can work through.

—Frank Gallinelli

####

Your time and your investment capital are too valuable to risk on a do-it-yourself investment spreadsheet. For more than 30 years, RealData has provided the best and most reliable real estate investment software to help you make intelligent investment decisions and to create presentations you can confidently show to lenders, clients, and equity partners. Learn more at www.realdata.com.

Copyright 2014,  Frank Gallinelli and RealData® Inc. All Rights Reserved

The information presented in this article represents the opinions of the author and does not necessarily reflect the opinions of RealData® Inc. The material contained in articles that appear on realdata.com is not intended to provide legal, tax or other professional advice or to substitute for proper professional advice and/or due diligence. We urge you to consult an attorney, CPA or other appropriate professional before taking any action in regard to matters discussed in any article or posting. The posting of any article and of any link back to the author and/or the author’s company does not constitute an endorsement or recommendation of the author’s products or services.

Understanding Net Operating Income

My recent discussions here of cash flow, DCF, pro formas and the like have prompted some readers to ask for a review of the key metrics that underlie a good and thorough income-property analysis.

One of the downsides of hanging around in business too long — we’re closing in on our 33rd anniversary — is that some of our best material is now lurking off in the archives.  So, after digging around in our virtual attic, I’ve found several topics that go to the heart of the matter, and that attracted quite a few readers when they first appeared.

Topping that list is our article about Net Operating Income. Here is a trailer of sorts, with a link to the complete article:

Understanding Net Operating Income

In a recent article, we discussed the use of capitalization rates to estimate the value of a piece of income-producing real estate. Our discussion concerned the relationship among three variables: Capitalization Rate, Present Value and Net Operating Income.

We may have gotten a bit ahead of ourselves, since some of our readers were unclear on the precise meaning of Net Operating Income. NOI, as it is often called, is a concept that is critical to the understanding of investment real estate, so we are going to backtrack a bit and review that subject here.

Everyone in business or finance has encountered the term, “net income” and understands its general meaning, i.e., what is left over after expenses are deducted from revenue.

With regard to investment real estate, however, the term, “Net Operating Income” is a minor variation on this theme and has a very specific meaning. …

read the rest of the article here—>>

—Frank Gallinelli

####

Your time and your investment capital are too valuable to risk on a do-it-yourself investment spreadsheet. For more than 30 years, RealData has provided the best and most reliable real estate investment software to help you make intelligent investment decisions and to create presentations you can confidently show to lenders, clients, and equity partners. Learn more at www.realdata.com.

Copyright 2014,  Frank Gallinelli and RealData® Inc. All Rights Reserved

The information presented in this article represents the opinions of the author and does not necessarily reflect the opinions of RealData® Inc. The material contained in articles that appear on realdata.com is not intended to provide legal, tax or other professional advice or to substitute for proper professional advice and/or due diligence. We urge you to consult an attorney, CPA or other appropriate professional before taking any action in regard to matters discussed in any article or posting. The posting of any article and of any link back to the author and/or the author’s company does not constitute an endorsement or recommendation of the author’s products or services.

Start Evaluating Investment Properties Today

Get Free Demo