We’ve been hiding our bundles under a bushel! Find out more >>

800-899-6060

The Case of the Mysterious Sinking IRR

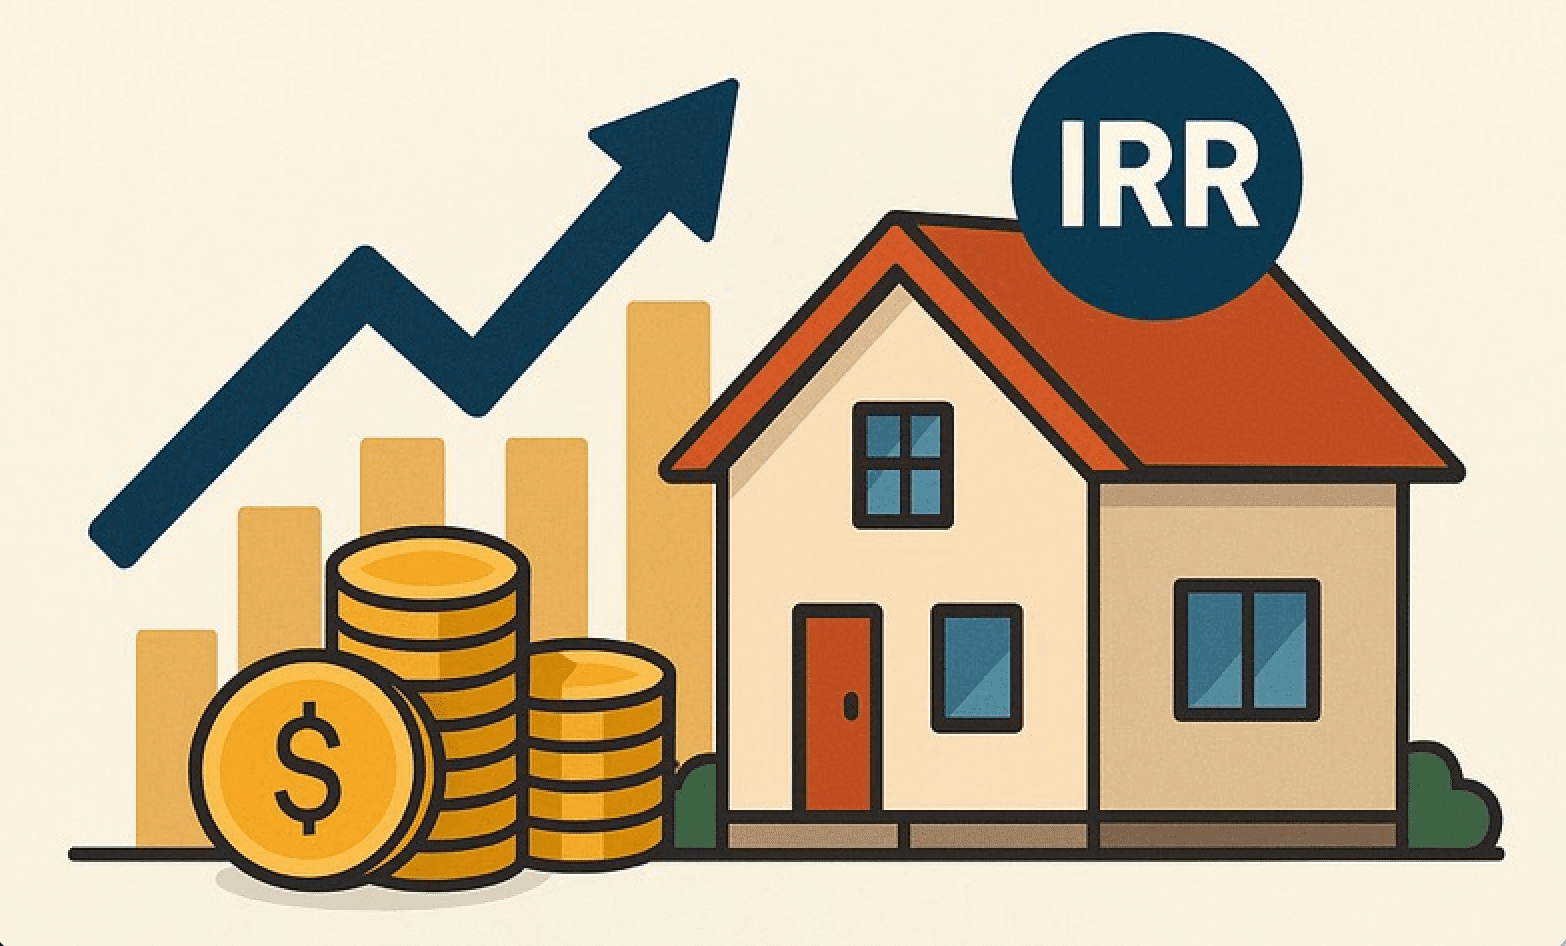
Users of our Real Estate Investment Analysis program sometimes call us with questions that are not about the software but about the underlying analysis. If we had a “greatest hits” list for those questions the all-time winner would be this: “My cash flow goes up each year; the value of the property goes up each year; but when I look at the Internal Rate of Return, it goes down almost every year. What’s up with that?” To see how this can happen, let’s take a look at two very simple examples.

Example #1: We purchase a property for $100,000 all cash. It has a Net Operating Income of $10,000, so the capitalization rate is 10%. We are going to assume that 10% is the right cap rate for this market (primarily because it make the math in our example easy to follow). Because we bought the property for cash there is no debt service and so we can also assume that the cash flow is the same as the Net Operating Income. For those who require an instant (and very abbreviated) refresher course on these concepts, use the following:

  • Gross Income less Operating Expenses equals Net Operating Income
  • Net Operating Income less Debt Service equals Cash Flow
  • Net Operating Income divided by Capitalization Rate equals the property’s Present Value

The property is in good shape and is running well when we buy it. Our initial cash flow occurs on Day One when we spend $100,000 in cash to make the purchase. We project that we can raise the rent 4% during the first year to $10,400. The property is well-located, so we believe we can get a bit more aggressive over time. We’ll project that we can increase the revenue 5% in the second year, 6% in the third, 7% in the fourth and 8% in the fifth. Here is what our projections look like:


Notice that, if we sell the property at the end of one year for its full value (i.e., with no selling costs, to keep matters simple), our Internal Rate of Return (IRR) is a pleasing 14.4%. If we sell at the end of year two, our IRR for that holding period is even better, 14.92%. If we hang on to the property for five years, we see that we can expect a 16.38% IRR. The rents go up each year, the value goes up and so does the IRR. All is right with the world.

Example #2: At the same time we buy another property, also for $100,000 cash. It too has a $10,000 NOI, but this property needs immediate management improvements to control expenses and to get rents in line with the market. We feel sure that we can get the NOI (and hence the cash flow) to $12,000 in the first year. That should get it on a stable footing, from which we expect a more modest 3% increase in rent each year thereafter. The rents go up each year, the value goes up each year, but what about the IRR?


At the end of the first year, we’re thrilled by a robust IRR of 32%. We worked hard; we deserve it. But if we hold the property for a second year the Internal Rate of Return drops to 22.76% — still not shabby but significantly lower than at the end of the prior year. Indeed, the longer we hold the property, the lower the IRR becomes. What, to coin a phrase, is wrong with this picture? Nothing is wrong, actually. The numbers are correct. Remember that Internal Rate of Return is a time-sensitive measurement. The biggest jump in cash flow and in the property’s value came early. The earlier it arrives, the less severely it gets discounted — it’s the “time value of money” concept. The increases that occur in years two through five are smaller to begin with and they get discounted over a greater number of years, shrinking their worth to us today even more.

Simply put, if we hold the property two years instead of one, then that second year dilutes the overall rate of return because it didn’t contribute as much (especially after an extra year of discounting) as the first year did. If we hold the property for three years, the return gets diluted still further.

At this point, someone in the back of the room is surely asking the insightful question, “So what?” Here’s what: The first property is telling us that it will perform better as an investment if we hold onto it for a while. Its rent increases are accelerating each year. Even though the increases have to be discounted — it’s that time value of money again — they’re growing at a pace that makes them worth waiting for. Hence the IRR gets higher with each year we hold on. The second property, however, has a bit more of a roman candle quality to its performance. The big flash comes early; after that, it just sputters along.

Does this mean you should immediately sell such a property? If you’re happy with the long-term IRR and could not find a replacement property with a greater yield, it might make sense to hold. Or you might be more comfortable following the words of immortal Janis Joplin: Get it while you can. To put that in more businesslike terms, you might decide to sell the property when the IRR peaks; then take the proceeds and reinvest them. Whichever way you go, the important thing is that you’ll be making an informed decision.

Better than being like this guy.


If you found this example helpful, I have a lot more educational material for real estate investors and developers. For example, check out these video lessons…

Real Estate Investment Case Studies where I take you step-by-step through the evaluation of five different property types: apartment, mixed-use, triple-net leased, retail strip center, and single-family property

Value-Add Real Estate Investments where I show how you might do something tangible or intangible to a property, but in either case, something that increases how much a person would pay to acquire that asset from you when you’re done.

Or if you’re ready for a complete training series in real estate investment, development, finance, partnerships, and more, consider Mastering Real Estate Investing.

—— Frank Gallinelli  


Copyright 2023,  Frank Gallinelli and RealData® Inc. All Rights Reserved

The information presented in this article represents the opinions of the author and does not necessarily reflect the opinions of RealData® Inc. The material contained in articles that appear on realdata.com is not intended to provide legal, tax or other professional advice or to substitute for proper professional advice and/or due diligence. We urge you to consult an attorney, CPA or other appropriate professional before taking any action in regard to matters discussed in any article or posting. The posting of any article and of any link back to the author and/or the author’s company does not constitute an endorsement or recommendation of the author’s products or services.


Love Your Hat! What is Your Lender Really Looking at When You Apply for a Commercial Mortgage?

If you’re not an all cash buyer, then when you purchase a piece of income-producing real estate you’ll probably need to secure mortgage financing to complete the deal. It’s essential for you to understand what your lender is looking at when underwriting that loan.

And — If you guessed that he or she is not admiring your millinery —  ok then, stick with me here. I’m going to discuss briefly a couple of key yardsticks.

Of course, this short video blog post is just the tip of the iceberg when it comes to evaluating, financing, and acquiring a successful real estate investment.

For in-depth insight into on all the key metrics and methods, check out https://realestateeducation.net/

And you’ll find the software that will do all the heavy lifting for your analysis and presentation at https://realdata.com


Copyright 2021,  Frank Gallinelli and RealData® Inc. All Rights Reserved

The information presented in this article represents the opinions of the author and does not necessarily reflect the opinions of RealData® Inc. The material contained in articles that appear on realdata.com is not intended to provide legal, tax or other professional advice or to substitute for proper professional advice and/or due diligence. We urge you to consult an attorney, CPA or other appropriate professional before taking any action in regard to matters discussed in any article or posting. The posting of any article and of any link back to the author and/or the author’s company does not constitute an endorsement or recommendation of the author’s products or services.


Video post: Understanding Net Operating Income, Part 2

In Part 1 this post, we looked at the revenue side of our NOI calculation. Now let’s look at the expense side, and how the end result – the NOI itself, is typically used when evaluating a potential real estate investment. Click the image below.


If you missed Part 1, you can watch it here.

Copyright 2021,  Frank Gallinelli and RealData® Inc. All Rights Reserved

The information presented in this article represents the opinions of the author and does not necessarily reflect the opinions of RealData® Inc. The material contained in articles that appear on realdata.com is not intended to provide legal, tax or other professional advice or to substitute for proper professional advice and/or due diligence. We urge you to consult an attorney, CPA or other appropriate professional before taking any action in regard to matters discussed in any article or posting. The posting of any article and of any link back to the author and/or the author’s company does not constitute an endorsement or recommendation of the author’s products or services.


Video post: Understanding Net Operating Income, Part 1

One topic that seems to generate a lot of interest and questions among investors I speak with is the subject of net operating income. Those who are new to real estate investing and even those with some experience are often unclear as to exactly what it is, what it means, and how to use it.

To shed some light on this topic, I’m going to try something new here – new for me at least – a video blog post. I’ll try to answer those questions by giving you a basic roadmap of how Net Operating Income is calculated, and how it’s used in real investment situations. So —  here we go with Part 1 of 2. Click the image below.

net operating income


Part 2 is now available here.


Copyright 2021,  Frank Gallinelli and RealData® Inc. All Rights Reserved

The information presented in this article represents the opinions of the author and does not necessarily reflect the opinions of RealData® Inc. The material contained in articles that appear on realdata.com is not intended to provide legal, tax or other professional advice or to substitute for proper professional advice and/or due diligence. We urge you to consult an attorney, CPA or other appropriate professional before taking any action in regard to matters discussed in any article or posting. The posting of any article and of any link back to the author and/or the author’s company does not constitute an endorsement or recommendation of the author’s products or services.


How to Look at Reserves for Replacement When You Invest in Income-Property

It may sound like a nit-picking detail: Where and how do you account for “reserves for replacement” when you try to value – and evaluate – a potential income-property investment? Isn’t this something your accountant sorts out when it’s time to do your tax return? Not really, and how you choose to handle it may have a meaningful impact on your investment decision-making process.


What are “Reserves for Replacement?”

Nothing lasts forever. While that observation may seem to be better suited to a discourse in philosophy, it also has practical application in regard to your property. Think HVAC system, roof, paving, elevator, etc. The question is simply when, not if, these and similar items will wear out.

A prudent investor may wish to put money away for the eventual rainy day (again, the roof comes to mind) when he or she will have to incur a significant capital expense. That investor may plan to move a certain amount of the property’s cash flow into a reserve account each year. Also, a lender may require the buyer of a property to fund a reserve account at the time of acquisition, particularly if there is an obvious need for capital improvements in the near future.

Such an account may go by a variety of names, the most common being “reserves for replacement,” “funded reserves,” or “capex (i.e., capital expenditures) reserves.”


Where do “Reserves for Replacement” Fit into Your Property Analysis?

This apparently simple concept gets tricky when we raise the question, “Where do we put these reserves in our property’s financial analysis?” More specifically, should these reserves be a part of the Net Operating Income calculation, or do they belong below the NOI line? Let’s take a look at examples of these two scenarios.

reserves for replacement, after NOI

Now let’s move the reserves above the NOI line.

reserves for replacement, befeore NOI

The math here is pretty basic. Clearly, the NOI is lower in the second case because we are subtracting an extra item. Notice that the cash flow stays the same because the reserves are above the cash flow line in both cases.


Which Approach is Correct?

There is, for want of a better term, a standard approach to the handling capital reserves, although it may not be the preferred choice in every situation.

That approach, which you will find in most real estate finance texts (including mine), in the CCIM courses on commercial real estate, and in our Real Estate Investment Analysis software, is to put the reserves below the NOI – in other words, not to treat reserves as having any effect on the Net Operating Income.

This makes sense, I believe, for a number of reasons. First, NOI by definition is equal to revenue minus operating expenses, and it would be a stretch to classify reserves as an operating expense. Operating expenses are costs incurred in the day-to-day operation of a property, costs such as property taxes, insurance, and maintenance. Reserves don’t fit that description, and in fact would not be treated as a deductible expense on your taxes.

Perhaps even more telling is the fact that we expect the money spent on an expense to leave our possession and be delivered to a third party who is providing some product or service. Funds placed in reserve are not money spent, but rather funds taken out of one pocket and put into another. It is still our money, unspent.


What Difference Does It Make?

Why do we care about the NOI at all? One reason is that it is common to apply a capitalization rate to the NOI in order to estimate the property’s value at a given point in time. The formula is familiar to most investors:

Value = Net Operating Income / Cap Rate

Let’s assume that we’re going to use a 7% market capitalization rate and apply it to the NOI. If reserves are below the NOI line, as in the first example above, then this is what we get:

Value = 55,000 / 0.07

Value = 785,712

Now let’s move the reserves above the NOI line, as in the second example.

Value = 45,000 / 0.07

Value = 642,855

With this presumably non-standard approach, we have a lower NOI, and when we capitalize it at the same 7% our estimate of value drops to $642,855. Changing how we account for these reserves has reduced our estimate of value by a significant amount, $142,857.


Is Correct Always Right?

I invite you now to go out and get an appraisal on a piece of commercial property. Examine it, and there is a very good chance you will find the property’s NOI has been reduced by a reserves-for-replacement allowance. Haven’t these people read my books?

The reality, of course, is that diminishing the NOI by an allowance for reserves is a more conservative approach to valuation. Given the financial meltdown of 2008 and its connection to real estate lending, it is not at all surprising that lenders and appraisers prefer an abundance of caution. Constraining the NOI not only has the potential to reduce valuation, but also makes it more difficult to satisfy a lender’s required Debt Coverage Ratio. Recall the formula:

Debt Coverage Ratio = Net Operating Income / Annual Debt Service

In the first case, with a NOI of $55,000, the DCR would equal 1.41. In the second, it would equal 1.15. If the lender required a DCR no less than 1.25 (a fairly common benchmark), the property would qualify in the first case, but not in the second.

It is worth keeping in mind that the estimate of value that is achieved by capitalizing the NOI depends, of course, on the cap rate that is used. Typically it is the so-called “market cap rate,” i.e., the rate at which similar properties in the same market have sold. It is essential to know the source of this cap rate data. Has it been based on NOIs that incorporate an allowance for reserves, or on the more standard approach, where the NOI is independent of reserves?

Obviously, there has to be consistency. If one chooses to reduce the NOI by the reserves, then one must use a market cap rate that is based on that same approach. If the source of market cap rate data is the community of brokers handling commercial transactions, then the odds are strong that the NOI used to build that market data did not incorporate reserves. It is likely that the brokers were trained to put reserves below the NOI line; in addition, they would have little incentive to look for ways to diminish the NOI and hence the estimate of market value.


The Bottom Line – One Investor’s Opinion

What I have described as the standard approach – where reserves are not a part of NOI – has stood for a very long time, and I would be loath to discard it. Doing so would seem to unravel the basic concept that Net Operating Income equals revenue net of operating expenses. It would also leave unanswered the question of what happens to the money placed in reserves. If it wasn’t spent then it still belongs to us, so how do we account for it?

At the same time, it would be foolish to ignore the reality that capital expenditures are likely to occur in the future, whether for improvements, replacement of equipment, or leasing costs.

For investors, perhaps the resolution is to recognize that, unlike an appraiser, we are not strictly concerned with nailing down a market valuation at a single point in time. Our interests extend beyond the closing and so perhaps we should broaden our field of vision. We should be more focused on the long term, the entire expected holding period of our investment – how will it perform, and does the price we pay justify the overall return we achieve?

Rather than a simple cap rate calculation, we may be better served by a Discounted Cash Flow analysis, where we can view that longer term, taking into account our financing costs, our funding of reserves, our utilization of those funds when needed, and the eventual recovery of unused reserves upon sale of the property.

In short, as investors, we may want not just to ask, “What is the market value today, based on capitalized NOI?” but rather, “What price makes sense in order to achieve the kind of return over time that we’re seeking?”

How do you treat reserves when you evaluate an income-property investment?

—-Frank Gallinelli

####

Your time and your investment capital are too valuable to risk on a do-it-yourself investment spreadsheet. For more than 30 years, RealData has provided the best and most reliable real estate investment software to help you make intelligent investment decisions and to create presentations you can confidently show to lenders, clients, and equity partners. Learn more at www.realdata.com.

Copyright 2014,  Frank Gallinelli and RealData® Inc. All Rights Reserved

The information presented in this article represents the opinions of the author and does not necessarily reflect the opinions of RealData® Inc. The material contained in articles that appear on realdata.com is not intended to provide legal, tax or other professional advice or to substitute for proper professional advice and/or due diligence. We urge you to consult an attorney, CPA or other appropriate professional before taking any action in regard to matters discussed in any article or posting. The posting of any article and of any link back to the author and/or the author’s company does not constitute an endorsement or recommendation of the author’s products or services.

Podcast: “Learn the key principles to effectively analyzing and evaluating your real estate deals”

I had the pleasure of recording a podcast recently with real estate entrepreneur Kevin Bupp. We discussed what I feel are some of the key principles that every real estate investor ought to understand — and so, I invite you to listen to that podcast here.


Using Cap Rate to Estimate the Value of an Investment Property

In recent posts I’ve been revisiting some key real estate investment metrics. Last time I discussed the finer points of Net Operating Income, and that topic should serve as an appropriate run-up to the subject of capitalization rates (aka cap rates). What are they and how do you use them?

Income capitalization is the technique typically used by commercial appraisers, and is a part of the decision-making process for most real estate investors as well. I invite you to jog over to an article I’ve written on the subject:

Estimating the Value of a Real Estate Investment Using Cap Rate

In addition, you can download Chapter 10 of my book, Mastering Real Estate Investment, which discusses cap rates and gives you several examples you can work through.

—Frank Gallinelli

####

Your time and your investment capital are too valuable to risk on a do-it-yourself investment spreadsheet. For more than 30 years, RealData has provided the best and most reliable real estate investment software to help you make intelligent investment decisions and to create presentations you can confidently show to lenders, clients, and equity partners. Learn more at www.realdata.com.

Copyright 2014,  Frank Gallinelli and RealData® Inc. All Rights Reserved

The information presented in this article represents the opinions of the author and does not necessarily reflect the opinions of RealData® Inc. The material contained in articles that appear on realdata.com is not intended to provide legal, tax or other professional advice or to substitute for proper professional advice and/or due diligence. We urge you to consult an attorney, CPA or other appropriate professional before taking any action in regard to matters discussed in any article or posting. The posting of any article and of any link back to the author and/or the author’s company does not constitute an endorsement or recommendation of the author’s products or services.

Understanding Net Operating Income

My recent discussions here of cash flow, DCF, pro formas and the like have prompted some readers to ask for a review of the key metrics that underlie a good and thorough income-property analysis.

One of the downsides of hanging around in business too long — we’re closing in on our 33rd anniversary — is that some of our best material is now lurking off in the archives.  So, after digging around in our virtual attic, I’ve found several topics that go to the heart of the matter, and that attracted quite a few readers when they first appeared.

Topping that list is our article about Net Operating Income. Here is a trailer of sorts, with a link to the complete article:

Understanding Net Operating Income

In a recent article, we discussed the use of capitalization rates to estimate the value of a piece of income-producing real estate. Our discussion concerned the relationship among three variables: Capitalization Rate, Present Value and Net Operating Income.

We may have gotten a bit ahead of ourselves, since some of our readers were unclear on the precise meaning of Net Operating Income. NOI, as it is often called, is a concept that is critical to the understanding of investment real estate, so we are going to backtrack a bit and review that subject here.

Everyone in business or finance has encountered the term, “net income” and understands its general meaning, i.e., what is left over after expenses are deducted from revenue.

With regard to investment real estate, however, the term, “Net Operating Income” is a minor variation on this theme and has a very specific meaning. …

read the rest of the article here—>>

—Frank Gallinelli

####

Your time and your investment capital are too valuable to risk on a do-it-yourself investment spreadsheet. For more than 30 years, RealData has provided the best and most reliable real estate investment software to help you make intelligent investment decisions and to create presentations you can confidently show to lenders, clients, and equity partners. Learn more at www.realdata.com.

Copyright 2014,  Frank Gallinelli and RealData® Inc. All Rights Reserved

The information presented in this article represents the opinions of the author and does not necessarily reflect the opinions of RealData® Inc. The material contained in articles that appear on realdata.com is not intended to provide legal, tax or other professional advice or to substitute for proper professional advice and/or due diligence. We urge you to consult an attorney, CPA or other appropriate professional before taking any action in regard to matters discussed in any article or posting. The posting of any article and of any link back to the author and/or the author’s company does not constitute an endorsement or recommendation of the author’s products or services.

The 50% Rule vs. Discounted Cash Flow Analysis

I like to read the discussions in a number of online real estate investment forums to see what issues are of interest to investors at all levels of experience. One topic that seems to excite a lot of commentary concerns the relative merits, or lack thereof, of projecting and analyzing the potential future cash flows from an investment property—call it Discounted Cash Flow (DCF) or pro forma analysis. Since I’ve spent a good part of my professional life teaching on this subject and providing software tools to accomplish such analyses, discussions like these jump out at me; and my last post promised a follow-up to my discourse on the income stream, so the saga continues.

I frequently see people lament that a cash flow pro forma is basically pointless.  You can’t predict the future; more specifically you can’t predict what a property’s revenue or expenses will be in any given year, so why bother trying? It’s a waste of time, so they say. I think this is an unnecessarily nihilistic take on investing, reducing attempts at thoughtful analysis to the level of palm reading and tarot cards.

The 50% Rule

Recently I have seen a lot of mention of a so-called “50% rule” as an alternative to DCF. If I understand it correctly, this rule says, “Take the gross rent and subtract 50%. That’s your Net Operating Income. Subtract your debt service and that’s your cash flow.”

So, 50% is supposed to account for your vacancy loss, operating expenses, reserves, and capital costs. Actually, these last two items aren’t part of NOI, but why quibble?

Somehow I can’t shake off the image of Michelangelo creating the Sistine Chapel ceiling with a paint roller.  Same level of precision.

Clearly, one set percentage—50% or anything else—could not possibly be appropriate for all property types, even in the same market. You would not expect your percentage of operating expenses for a triple-net-leased single-tenant building to be the same as that for an office building. Even within one property type, would you bet the farm on the expense percentage for a 100-unit apartment complex to be identical to that of a 6-unit multi-family house?

Let’s grant that a certain expense percentage might be typical for a given property type in a given location. Would you really be comfortable using that percentage to make a specific purchase decision?  It might work out if you were buying the entire market, but would you risk your investment capital on the assumption that the one property you want to buy is truly typical of the entire market?

Sadly, I find too many investors dismiss the importance of doing a Discounted Cash Flow Analysis and opt instead for this sort of very simplified—dare I say oversimplified—approach. Such a technique might suffice as a general guideline for smaller properties, but when one gets involved with true income properties—larger residential or just about any size commercial investment—I don’t see how you can commit a serious amount of cash without performing a DCF analysis as part of your decision-making process.

Due Diligence and DCF

I talk a lot in my books, articles, and podcasts about the importance of due diligence; and that process is really at the heart of making an intelligent and informed cash flow projection. You cannot know your future operating costs precisely, nor perhaps your revenue; but you can certainly make reasonable estimates that are not just global generalities but are specific to the investment you’re considering. Keep in mind that due diligence for a real estate investment has two distinct parts:

  • The property itself — What is the actual current revenue? Do the leases call for scheduled rent increases? What are the current, verified operating expenses, and what are reasonable estimates going forward? Does the physical condition of the property suggest capital expenditures will be needed during your expected holding period? Will you set aside reserves for those? What are the costs and terms of available financing for this property?
  • The market — Properties don’t live in a vacuum, so market data is crucial.  What are the prevailing rents for this type of property in this market (i.e., what is the competition)? What are the local vacancy levels, cap rates, and general economic trends?

Next, use that data to project current performance along with best-case, worst-case, and in-between scenarios of future performance. This is where you start to take the investment’s vital signs: Under what circumstances will the cash flow be adequate, is the debt coverage ratio strong enough to secure financing with a given down payment, what if a commercial tenant’s shaky business fails before their lease expires?

Use the projections not only to make a decision about an appropriate price and terms for the property, but also use the DCF to demonstrate (i.e., “sell”) your reasoning to the other parties involved in the transaction: to the seller if you’re the buyer, the buyer if you’re the seller; to the lender; or to your potential equity partners.

Investment is all about balancing risk and reward; and these, in turn, require a willingness to make investment decisions in an environment where you necessarily have to work with incomplete or imperfect information. If there were no uncertainties, then everyone would be a winner.

Uncertainties such as these, however, are in the context of the actual property and the actual market. They are not the random application of a universal constant that has no particular connection to the investment under consideration. Buying and operating an investment property involves commitment, and that should start with a thorough financial analysis. Projecting the potential future performance of an investment property, especially with multiple scenarios, is the best way to make an informed and intelligent decision.

— Frank Gallinelli

####

Your time and your investment capital are too valuable to risk on a do-it-yourself investment spreadsheet. For more than 30 years, RealData has provided the best and most reliable real estate investment software to help you make intelligent investment decisions and to create presentations you can confidently show to lenders, clients, and equity partners. Learn more at www.realdata.com.

Copyright 2014,  Frank Gallinelli and RealData® Inc. All Rights Reserved

The information presented in this article represents the opinions of the author and does not necessarily reflect the opinions of RealData® Inc. The material contained in articles that appear on realdata.com is not intended to provide legal, tax or other professional advice or to substitute for proper professional advice and/or due diligence. We urge you to consult an attorney, CPA or other appropriate professional before taking any action in regard to matters discussed in any article or posting. The posting of any article and of any link back to the author and/or the author’s company does not constitute an endorsement or recommendation of the author’s products or services.


The Cash-on-Cash Conundrum, Part 2

In the first part of our discussion, you looked at the simple math that underlies Cash-on-Cash Return. The short version goes like this:  First you calculate your property’s first-year cash flow before taxes—essentially all the cash that comes in from operating the property minus all the cash that goes out. Then you divide that by your initial cash investment, and that percentage is your Cash-on-Cash Return. Nothing could be simpler.

Simplicity is a good part of CoC’s appeal. Unfortunately, that is also part of its weakness. If you are using this metric to help you decide whether a potential income-property purchase is a promising investment or not, then you need to look carefully at the story—or stories—that may lurk behind these numbers. In keeping with our literary metaphor, let’s call them our subplots.

Subplot #1: A Point in Time

Clearly, when you take the first-year’s cash flow and divide it by the cash used to purchase, you are looking at a property’s performance essentially at a point in time, a single year. To be sure, the reliability of your cash flow projection is likely to be greatest in that one, immediate time frame. I often hear investors say that they are not comfortable trying to predict the future, that they would rather just look at what is happening now; and they are quite justified in saying that if the return looks grim or perhaps negative right out of the box, then they have no interest in looking further.

Understandable, but potentially shortsighted—literally. By looking at a single year, you are looking at what may be an improbable investment horizon.  Will you keep this property for just one year? If not, if you plan to hold on to it longer, then you’re not taking into account anything having to do with its possible future performance.  Do you believe each future year will be exactly like this year, or could reasonably anticipated changes in cash flow (such as schedule increases in commercial lease rents, or large expenditures for needed repairs) push the needle far to one end or the other?

Subplot #2: The Time Value of Money

“All right,” you say, “then I’ll estimate the Cash-on-Cash Return for each of the next several years.” That may look like a step in the right direction, and I talk to a lot of folks who insist on doing just that, but it won’t take into account the time value of money.  You’ll be looking at the face value (undiscounted) of expected future cash flows, and weighing them against the present value of your cash investment today. Go back to that original example, where you invested $100,000. If you predict a $20,000 cash flow ten years from now, does that really mean your investment is returning 20%?

To be fair, future-year Cash-on-Cash can impart some useful information. For example, if the metric is both positive and increasing, then you can infer that your cash flow is improving each year. The trend can help inform your decision, but the actual percentage return may not have a great deal of meaning.

Subplot #3: Smoke and Mirrors

You retreat and say, “OK, let’s go back to thinking about just the first year of operation. Surely the Cash-on-Cash should give me a good sense of initial performance.” Do you remember the old computer chestnut, “Garbage in, garbage out?” Your results are only as good as the assumptions and data that you put in the dispose-all, and perhaps things aren’t always (or ever) what they seem.

Consider:

You are looking at in income-and-expense statement (what we call an APOD in real estate investing—Annual Property Operating Data) provided by the seller of the property. The cash flow is based, in part, on operating expenses, one of which is Maintenance and Repairs. The figure in the example above is $6,000; you secure the owner’s tax return and confirm that this is indeed the figure he declared.

That is how much he actually spent, but the figure seems a bit low to you. Does it mean the owner performed as little maintenance as he could get away with and never fixed anything until it was absolutely necessary?  Perhaps the owner did this to prop up the property’s cash flow in anticipation of selling. Despite the fact that the expense disclosed is technically correct, you decide you shouldn’t use it as a forward-looking assumption. Instead, you will probably have to project spending more once you take ownership, resulting in a diminished cash flow and a lower Cash-on-Cash Return. In addition, the property may actually be worth less than you assumed, since it does not throw off as much net income as you were led to believe.

Now take a different point of view. Based on your experience, you think the maintenance and repair expenditure shown is surprisingly high. Could there be an explanation for that? Perhaps the owner used the past year to catch up on deferred maintenance so the property would look more presentable when he put it up for sale.  You might be tempted (but only in your most private thoughts) to test the impact of lower maintenance costs on your cash flow and CoC return.  Once again, the amount that was disclosed, although correct, may not be the amount that gives you the best estimate of future cash flow or Cash-on-Cash Return.

Subplot #4: The Forecast—Cloudy, with a Chance of Cash Flow

Finally, there is the larger issue of the structure of the cash flow statement itself. What you decide to include or exclude in your forecast of future cash flow will almost certainly be driven by your personal agenda in creating that cash flow statement.  Are you the seller of the property, looking to make its income stream appear as strong as possible? Are you the buyer, trying to make a realistic projection of how this property will really perform, and perhaps also conveying that stark realism back to the seller as part of your price negotiation?

In either case—as well as in any of several others, such as buyer looking for financing, general partner looking for equity investors, etc.—you might be putting a bit of a spin on the data, the better to support your point of view and the message you want to deliver.

If you’re the seller, then a bit of topspin seems like a good idea to you. In the example shown in Part 1 of this discussion, you might argue that, not only did you provide accurate and verifiable income and expense data, but that you were being exceptionally open and above-board by suggesting an allowance for vacancy and credit loss even though you experienced no such loss.  Group hug.

But if you’re the buyer, you might return this with some backspin. You thank the seller for being so forthright, but add that you believe the vacancy and credit loss allowance should be closer to 5%, not 3%. In addition, you point out that routine maintenance is great, but will not prevent big-ticket items from wearing out eventually. For example, the heating boiler is barely hanging on, and the flat roof has less than 10 years of life left in it. Hence you propose reconstructing the cash flow statement to reflect the higher vacancy allowance, as well as need for an immediate capital improvement and an ongoing set-aside of cash flow into a reserve account to deal with future replacements, such as the roof.

coc2-1

What previously was a robust 10.4% return now becomes an anemic 2.1%.

coc2-2

The seller objects that this isn’t entirely fair, since the boiler repair is a one-off event, and removing that cost would bring us up to 6.1%.

coc2-3

The seller’s argument cycles you right back to Subplot #1 about the hazards of relying on a rate-of-return metric that looks only at a point in time in what is probably going to be a long-term investment.

Is There a Bottom Line?

What should you conclude about Cash-on-Cash Return? Is it, as some contend, the only metric worth looking at?  Is it of no use at all? The best answer probably lies somewhere in between, that you need to recognize both CoC’s strengths and its limitations, and not rely on it as your sole investment decision-making tool.

On the plus side:

  • It is quick and easy to calculate.
  • It can give an immediate comparison to the return on other short-term investments.
  • It focuses on the most current performance of the property; the more recent the data, the more likely it is to be reliable.

Among the negatives:

  • It focuses on single point in time; you may be intending to buy and hold for an extended period, and the future performance of the property can differ greatly from the short term.
  • It does not take into account the time value of money; if you use it beyond the current period, you may be comparing a future, undiscounted cash flow to the amount invested today.
  • It is easy to manipulate the results; hence, a novice investor who relies on this metric alone can be misled by what a third party chooses to include or exclude from a property’s cash flow statement.

So are there some bottom-line recommendations here?  Of course.

Start off by trying to develop a CoC calculation in which you can have reasonable confidence.

To do so, remember that there is no substitute for due diligence. At the most basic level, you need to confirm whether the data you see on the cash flow statement for a particular property is reasonable and accurate. Then you need to go further and examine the physical property and the market to see if there are issues that may affect your confidence in those numbers. Is there any reason to doubt that the current revenue stream will continue as it is now? Is the demand for space in this market changing, for good or ill? Is there deferred maintenance that you will have to deal with? Based on what you find, you may have to reconstruct that cash flow statement.

Don’t just look at what is on the cash flow statement; look for what might be missing. A seller may not volunteer an allowance for vacancy or a need to fund a reserve account, but such items are going to be part of your reality as an owner.

So long as you approach it with sufficient care and due diligence, the Cash-on-Cash Return can give you a useful first look at how a property might perform; but before you commit your investment dollars, you need to do more.

If you plan to operate this property for several years, then you need to take the long view. You should identify your likely investment horizon, and then build a series of pro formas to forecast how the property might perform over time.

A series? Yes. Don’t try to nail your projections of future performance in one pass. Do a best-case, worst-case, and in-between forecast of future cash flows and ultimate resale of the property. Look at the ongoing Debt Coverage Ratio in each case. Examine the IRR or MIRR. Even compare this property to others you might be able to acquire.

Be thorough. Be wary of shortcuts. You’re buying a future income stream; do your homework and run your numbers so you can understand just what it is that you’re buying.  Your investment success depends on it.

read my postscript

— Frank Gallinelli

####

Your time and your investment capital are too valuable to risk on a do-it-yourself investment spreadsheet. For more than 30 years, RealData has provided the best and most reliable real estate investment software to help you make intelligent investment decisions and to create presentations you can confidently show to lenders, clients, and equity partners. Learn more at www.realdata.com.

Copyright 2013,  Frank Gallinelli and RealData® Inc. All Rights Reserved

The information presented in this article represents the opinions of the author and does not necessarily reflect the opinions of RealData® Inc. The material contained in articles that appear on realdata.com is not intended to provide legal, tax or other professional advice or to substitute for proper professional advice and/or due diligence. We urge you to consult an attorney, CPA or other appropriate professional before taking any action in regard to matters discussed in any article or posting. The posting of any article and of any link back to the author and/or the author’s company does not constitute an endorsement or recommendation of the author’s products or services.

Start Evaluating Investment Properties Today

Get Free Demo