We’ve been hiding our bundles under a bushel! Find out more >>

800-899-6060

What Does the Future Hold for Commercial Real Estate?

Inflation, interest rates, concerns about recession, pandemic-inspired work-style changes, taxes. There are enough wild cards in the deck to give any economic forecaster vertigo.

Not all real estate markets or all sectors are created equal, so to paraphrase an old TV auto ad, your mileage may vary. Nonetheless, we think it’s possible to make at least some reasonable and general forecasts about the near-term prospects for commercial real estate. Here is some of what we’re hearing, and thinking.

Multifamily

The multifamily sector seems likely to continue showing positive revenue growth. Freddie Mac predicts 3.5% increase in gross income nationally from apartment rentals in 2023, and a 5.1% vacancy rate. The multifamily market was outrageously strong in 2021, has cooled off somewhat since then, but still looks like a propitious place for investor dollars. With mortgage rates at their highest level in years, and the inventory of single-family homes for sale in short supply in many areas, there should be a lot of folks who must opt for apartments — hence, continued strong demand. Globest suggests that “multifamily remains a front-running investment choice.”

Office

The office market seems a bit harder to get a handle on. Many office workers have become very comfortable with working from home and are reluctant to go back into the office. They’ve been saving on commuting costs, especially in a time of high gas prices, on child care, and sometimes even on the cost of business attire. Some employers are demanding that workers return full time, but many are agreeing to a hybrid model, a few days a week in the office and a few at home. For many businesses, this means they need less office space. An in-depth interview on Co-Star with three industry analysts concurs that hybrid work is here for the long term and that demand for space is likely to decrease.

These analysts also noted that the suburban office market has been more resilient than the central business districts, and that suburban vacancies have actually been lower than those in CBDs. Finally, they note that while office leasing appears to be stabilizing, rising interest rates have been putting a damper on sales.

Industrial

If there is one clear winner right now, it would appear to be the industrial sector. In an article on trends in industrial real estate, commercialsearch.com says, “Onshoring efforts, coupled with a continuation of last year’s e-commerce boom, have only added to the already sky-high demand for industrial real estate.” It further quotes an analyst who believes this sector will be “among top performers across the commercial real estate sector in 2023.”

Similarly, NAIOP’s Industrial Space Demand Forecast says, ”Despite rising interest rates and growth in the supply of new space entering the market, the outlook for industrial real estate remains bright as supply chain conditions steadily improve. Low vacancy rates will continue to support growth in rents and property values.”

Retail

Retail, like politics, tends to be hyper-local. A recent article in the Wall Street Journal, The Decline of the Five-Day Commute Is a Boon to Suburban Retail, puts this in the context of the post-pandemic environment. The trend of businesses moving their office out of the central business district has led to fewer people shopping in downtown locations; but on the flip side, the suburbs have generally been the beneficiaries. “In the second half of last year, urban retail availability surpassed suburban availability for the first time since at least 2013, according to real-estate firm CBRE. Asking rent growth in the suburbs also outpaced urban areas last year.”

Overall — Sustainability

One phenomenon that looks like it will cut across all sectors is the growing interest in sustainability. It seems very likely that this will drive demand for green buildings. As we all become more aware of the impact that buildings can have on the environment, there is a growing demand for green buildings that are designed to be energy-efficient and environmentally friendly. This is creating opportunities for developers who can build green buildings. There are also financial incentives to commercial property owners, including reduced operating costs, increased asset value, and higher rents. We’ll be having a follow-up post with more on this soon, so stay tuned.

Frank Gallinelli


Copyright 2022,  Frank Gallinelli and RealData® Inc. All Rights Reserved
The information presented in this article represents the opinions of the author and does not necessarily reflect the opinions of RealData® Inc. The material contained in articles that appear on realdata.com is not intended to provide legal, tax or other professional advice or to substitute for proper professional advice and/or due diligence. We urge you to consult an attorney, CPA or other appropriate professional before taking any action in regard to matters discussed in any article or posting. The posting of any article and of any link back to the author and/or the author’s company does not constitute an endorsement or recommendation of the author’s products or services.  Building photo by John Unwin on Unsplash Solar array photo by Trinh Trần on pexels.com

The Case of the Mysterious Sinking IRR

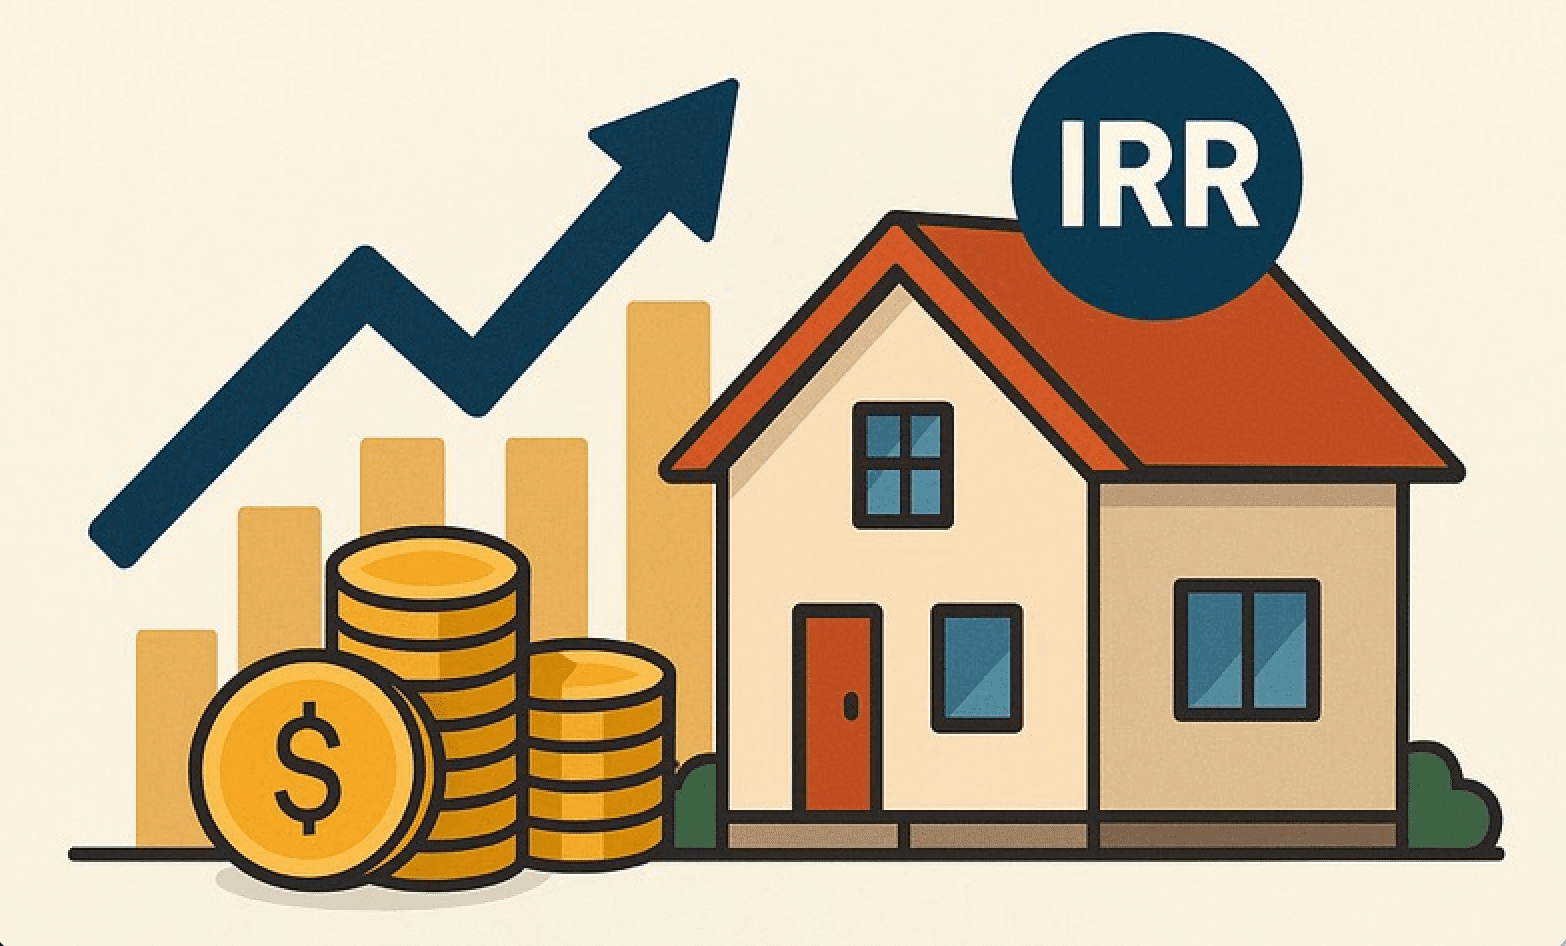
Users of our Real Estate Investment Analysis program sometimes call us with questions that are not about the software but about the underlying analysis. If we had a “greatest hits” list for those questions the all-time winner would be this: “My cash flow goes up each year; the value of the property goes up each year; but when I look at the Internal Rate of Return, it goes down almost every year. What’s up with that?” To see how this can happen, let’s take a look at two very simple examples.

Example #1: We purchase a property for $100,000 all cash. It has a Net Operating Income of $10,000, so the capitalization rate is 10%. We are going to assume that 10% is the right cap rate for this market (primarily because it make the math in our example easy to follow). Because we bought the property for cash there is no debt service and so we can also assume that the cash flow is the same as the Net Operating Income. For those who require an instant (and very abbreviated) refresher course on these concepts, use the following:

  • Gross Income less Operating Expenses equals Net Operating Income
  • Net Operating Income less Debt Service equals Cash Flow
  • Net Operating Income divided by Capitalization Rate equals the property’s Present Value

The property is in good shape and is running well when we buy it. Our initial cash flow occurs on Day One when we spend $100,000 in cash to make the purchase. We project that we can raise the rent 4% during the first year to $10,400. The property is well-located, so we believe we can get a bit more aggressive over time. We’ll project that we can increase the revenue 5% in the second year, 6% in the third, 7% in the fourth and 8% in the fifth. Here is what our projections look like:


Notice that, if we sell the property at the end of one year for its full value (i.e., with no selling costs, to keep matters simple), our Internal Rate of Return (IRR) is a pleasing 14.4%. If we sell at the end of year two, our IRR for that holding period is even better, 14.92%. If we hang on to the property for five years, we see that we can expect a 16.38% IRR. The rents go up each year, the value goes up and so does the IRR. All is right with the world.

Example #2: At the same time we buy another property, also for $100,000 cash. It too has a $10,000 NOI, but this property needs immediate management improvements to control expenses and to get rents in line with the market. We feel sure that we can get the NOI (and hence the cash flow) to $12,000 in the first year. That should get it on a stable footing, from which we expect a more modest 3% increase in rent each year thereafter. The rents go up each year, the value goes up each year, but what about the IRR?


At the end of the first year, we’re thrilled by a robust IRR of 32%. We worked hard; we deserve it. But if we hold the property for a second year the Internal Rate of Return drops to 22.76% — still not shabby but significantly lower than at the end of the prior year. Indeed, the longer we hold the property, the lower the IRR becomes. What, to coin a phrase, is wrong with this picture? Nothing is wrong, actually. The numbers are correct. Remember that Internal Rate of Return is a time-sensitive measurement. The biggest jump in cash flow and in the property’s value came early. The earlier it arrives, the less severely it gets discounted — it’s the “time value of money” concept. The increases that occur in years two through five are smaller to begin with and they get discounted over a greater number of years, shrinking their worth to us today even more.

Simply put, if we hold the property two years instead of one, then that second year dilutes the overall rate of return because it didn’t contribute as much (especially after an extra year of discounting) as the first year did. If we hold the property for three years, the return gets diluted still further.

At this point, someone in the back of the room is surely asking the insightful question, “So what?” Here’s what: The first property is telling us that it will perform better as an investment if we hold onto it for a while. Its rent increases are accelerating each year. Even though the increases have to be discounted — it’s that time value of money again — they’re growing at a pace that makes them worth waiting for. Hence the IRR gets higher with each year we hold on. The second property, however, has a bit more of a roman candle quality to its performance. The big flash comes early; after that, it just sputters along.

Does this mean you should immediately sell such a property? If you’re happy with the long-term IRR and could not find a replacement property with a greater yield, it might make sense to hold. Or you might be more comfortable following the words of immortal Janis Joplin: Get it while you can. To put that in more businesslike terms, you might decide to sell the property when the IRR peaks; then take the proceeds and reinvest them. Whichever way you go, the important thing is that you’ll be making an informed decision.

Better than being like this guy.


If you found this example helpful, I have a lot more educational material for real estate investors and developers. For example, check out these video lessons…

Real Estate Investment Case Studies where I take you step-by-step through the evaluation of five different property types: apartment, mixed-use, triple-net leased, retail strip center, and single-family property

Value-Add Real Estate Investments where I show how you might do something tangible or intangible to a property, but in either case, something that increases how much a person would pay to acquire that asset from you when you’re done.

Or if you’re ready for a complete training series in real estate investment, development, finance, partnerships, and more, consider Mastering Real Estate Investing.

—— Frank Gallinelli  


Copyright 2023,  Frank Gallinelli and RealData® Inc. All Rights Reserved

The information presented in this article represents the opinions of the author and does not necessarily reflect the opinions of RealData® Inc. The material contained in articles that appear on realdata.com is not intended to provide legal, tax or other professional advice or to substitute for proper professional advice and/or due diligence. We urge you to consult an attorney, CPA or other appropriate professional before taking any action in regard to matters discussed in any article or posting. The posting of any article and of any link back to the author and/or the author’s company does not constitute an endorsement or recommendation of the author’s products or services.


Educating Real Estate Investors — Third Episode in My New Podcast Series

Welcome back to my new podcast series. In my first interview I answered some questions about how I got started as an investor, and I hope my experience provided some ideas for you if you’re just looking to get started yourself. 

And in the second, I talked about my first commercial investment, which is where I really found my way in leveraging technology, and which led to the birth of RealData software.

In this third interview I discuss how my experiences with the software company evolved into a passion for investor education.

Below is a snippet of the video version of this podcast. You can watch the entire video on youtube, or visit our complete youtube video library (lots of good stuff there for investors). You can also listen to the audio version of my podcasts on Spotify, Apple, or on most anyplace you usually get your podcasts.


Copyright 2023,  Frank Gallinelli and RealData® Inc. All Rights Reserved

The information presented in this article represents the opinions of the author and does not necessarily reflect the opinions of RealData® Inc. The material contained in articles that appear on realdata.com is not intended to provide legal, tax or other professional advice or to substitute for proper professional advice and/or due diligence. We urge you to consult an attorney, CPA or other appropriate professional before taking any action in regard to matters discussed in any article or posting. The posting of any article and of any link back to the author and/or the author’s company does not constitute an endorsement or recommendation of the author’s products or services.


Evaluating an Income Property and the Birth of RealData — Second Episode in My New Podcast Series

Welcome back to my new podcast series. In my first interview I answered some questions about how I got started as an investor, and I hope my experience provided some ideas for you if you’re just looking to get started yourself. 

Now I want to take you on the next few steps in my journey and talk about how I came to learn about analyzing income-property investments.

In this interview I tell you about my first commercial investment, which is where I really found my way in leveraging technology, and which led to the birth of RealData software.

Below is a snippet of the video version of this podcast. You can watch the entire video on youtube, or visit our complete youtube video library (lots of good stuff there for investors). You can also listen to the audio version of my podcasts on Spotify, Apple, or on most anyplace you usually get your podcasts.


UPDATE: Episode 3 is available now!


Copyright 2023,  Frank Gallinelli and RealData® Inc. All Rights Reserved

The information presented in this article represents the opinions of the author and does not necessarily reflect the opinions of RealData® Inc. The material contained in articles that appear on realdata.com is not intended to provide legal, tax or other professional advice or to substitute for proper professional advice and/or due diligence. We urge you to consult an attorney, CPA or other appropriate professional before taking any action in regard to matters discussed in any article or posting. The posting of any article and of any link back to the author and/or the author’s company does not constitute an endorsement or recommendation of the author’s products or services.


Getting Started in Real Estate Investing — First Episode in My New Podcast Series

You probably all know me as a “numbers guy” who focuses on metrics and analysis of potential real estate investments.

But I hear lot of people who sound frustrated or discouraged by a very basic question: Just how do I get started?

So I’m going to step back from my spreadsheets for a bit and try to address that question — and I’ll do it in this first of a series of podcasts where I’ll talk about the not-so-exotic way I began. Spoiler alert: I’ll discuss something I did back then that I didn’t know had a name, something called BRRRR.

The video below is a snippet from the first podcast. You can listen to the whole thing on Spotify, Apple, or on most anyplace you usually get your podcasts.


UPDATE: Episode 2 is available now!

 
Copyright 2023,  Frank Gallinelli and RealData® Inc. All Rights Reserved

The information presented in this article represents the opinions of the author and does not necessarily reflect the opinions of RealData® Inc. The material contained in articles that appear on realdata.com is not intended to provide legal, tax or other professional advice or to substitute for proper professional advice and/or due diligence. We urge you to consult an attorney, CPA or other appropriate professional before taking any action in regard to matters discussed in any article or posting. The posting of any article and of any link back to the author and/or the author’s company does not constitute an endorsement or recommendation of the author’s products or services.


Return on Equity — What a Non-Traditional Approach Can Reveal

We usually think of Return on Equity (ROE) as a straightforward investment measure. That’s understandable, because the traditional method of calculating ROE is pretty clear cut: Take your cash flow after taxes and divide it by your initial cash investment.

This in fact is just a hop-and-a-step away from another popular measure, Cash-on-Cash Return (aka Equity Dividend Rate). The only difference is that Cash-on-Cash uses the cash flow before taxes.

Whichever of the two appeals to you more – and we’ll stick with ROE for simplicity here – the measurement will give you a quick sense of how your cash flow measures up to its cost.

There is a non-traditional approach, however, that we use in our Real Estate Investment Analysis software – an approach that can tell you something quite different about your income-property investment. This not-so-standard method differs in its definition of “equity.” Instead of looking at the actual dollars invested, you look instead at potential equity at a particular point in time. That equity is not what you invested, but rather the difference between what you believe the property is worth at that time and what you still owe in mortgage financing. So, if you look at the equity after one year (or two or three), you’ll be taking into account the growth or decline in the property’s value as well as the amortization of your mortgage.

Our non-standard formula now looks like this:

This measurement becomes interesting if you apply it in a multi-year projection. Let’s assume that you make projections about a property’s performance over a number of years and that you include in those projections the potential resale value and mortgage balances for each year (as we do in our REIA software). Whether or not you actually sell the property in any particular year, you accept the idea that your equity at a given time is the difference between what your property is worth and what you owe on your mortgages. By this reasoning, your return on equity measures not how your cash flow performs in relation to how much you originally invested, but rather how it performs in relation to how much you currently have “tied up” in this property.

What difference does it make? Consider this situation; you project that your property’s cash flow and resale value will increase each year but when you calculate the ROE you find the following:

You observe that your ROE starts going down at some point even though the value of the property and the Cash Flow After Taxes continue to go up. Is this a mistake? No, it can occur if the equity grows at a rate that is faster than the growth in cash flow. With our non-standard definition, your equity can grow when the value of the property increases or the mortgage balance decreases – or both. Mortgage amortization typically accelerates over time, so that alone can accelerate the growth in your potential equity. ROE is a simple ratio, so if the equity grows faster than the cash flow, then the Return on Equity will decline over time.

What does this decline mean to you as an investor? It means you have more and more potentially usable, investable cash tied up in this property and that the return on that cash is declining. Is that a bad thing? Not absolutely – it depends on your alternative uses for the money. If you were to refinance and extract some of that equity, could you purchase another property and earn a greater overall return? If you sold, could you use the funds realized to move up to a larger or better property, one with a better long-term upside?

If the answer to any of these questions is yes, or even maybe, then being tuned into to the message from this alternative method calculating ROE can give you the heads-up you need to maximize your investment dollars.

Frank Gallinelli

To make this kind of ROE projection – and to analyze all facets of your income-property investment – use our Real Estate Investment Analysis software with its numerous rate-of-return, cash flow and resale metrics

Copyright 2022,  Frank Gallinelli and RealData® Inc. All Rights Reserved

The information presented in this article represents the opinions of the author and does not necessarily reflect the opinions of RealData® Inc. The material contained in articles that appear on realdata.com is not intended to provide legal, tax or other professional advice or to substitute for proper professional advice and/or due diligence. We urge you to consult an attorney, CPA or other appropriate professional before taking any action in regard to matters discussed in any article or posting. The posting of any article and of any link back to the author and/or the author’s company does not constitute an endorsement or recommendation of the author’s products or services. Photo by Giorgio Trovato on Unsplash 


What Happened to Your Property Management?

If you’ve taken my video course, read any of my books, listened to some of the podcasts I’ve been on, then you’re very aware that I often rant about how important it is for you to account for just the real operating operating expenses when you evaluate the worth of a property — no more and no fewer.

There is one mistake I see really often, and I want to call it out here in this video blog.


Copyright 2021,  Frank Gallinelli and RealData® Inc. All Rights Reserved
The information presented in this article represents the opinions of the author and does not necessarily reflect the opinions of RealData® Inc. The material contained in articles that appear on realdata.com is not intended to provide legal, tax or other professional advice or to substitute for proper professional advice and/or due diligence. We urge you to consult an attorney, CPA or other appropriate professional before taking any action in regard to matters discussed in any article or posting. The posting of any article and of any link back to the author and/or the author’s company does not constitute an endorsement or recommendation of the author’s products or services.

Love Your Hat! What is Your Lender Really Looking at When You Apply for a Commercial Mortgage?

If you’re not an all cash buyer, then when you purchase a piece of income-producing real estate you’ll probably need to secure mortgage financing to complete the deal. It’s essential for you to understand what your lender is looking at when underwriting that loan.

And — If you guessed that he or she is not admiring your millinery —  ok then, stick with me here. I’m going to discuss briefly a couple of key yardsticks.

Of course, this short video blog post is just the tip of the iceberg when it comes to evaluating, financing, and acquiring a successful real estate investment.

For in-depth insight into on all the key metrics and methods, check out https://realestateeducation.net/

And you’ll find the software that will do all the heavy lifting for your analysis and presentation at https://realdata.com


Copyright 2021,  Frank Gallinelli and RealData® Inc. All Rights Reserved

The information presented in this article represents the opinions of the author and does not necessarily reflect the opinions of RealData® Inc. The material contained in articles that appear on realdata.com is not intended to provide legal, tax or other professional advice or to substitute for proper professional advice and/or due diligence. We urge you to consult an attorney, CPA or other appropriate professional before taking any action in regard to matters discussed in any article or posting. The posting of any article and of any link back to the author and/or the author’s company does not constitute an endorsement or recommendation of the author’s products or services.


Video post: Understanding Net Operating Income, Part 2

In Part 1 this post, we looked at the revenue side of our NOI calculation. Now let’s look at the expense side, and how the end result – the NOI itself, is typically used when evaluating a potential real estate investment. Click the image below.


If you missed Part 1, you can watch it here.

Copyright 2021,  Frank Gallinelli and RealData® Inc. All Rights Reserved

The information presented in this article represents the opinions of the author and does not necessarily reflect the opinions of RealData® Inc. The material contained in articles that appear on realdata.com is not intended to provide legal, tax or other professional advice or to substitute for proper professional advice and/or due diligence. We urge you to consult an attorney, CPA or other appropriate professional before taking any action in regard to matters discussed in any article or posting. The posting of any article and of any link back to the author and/or the author’s company does not constitute an endorsement or recommendation of the author’s products or services.


Video post: Understanding Net Operating Income, Part 1

One topic that seems to generate a lot of interest and questions among investors I speak with is the subject of net operating income. Those who are new to real estate investing and even those with some experience are often unclear as to exactly what it is, what it means, and how to use it.

To shed some light on this topic, I’m going to try something new here – new for me at least – a video blog post. I’ll try to answer those questions by giving you a basic roadmap of how Net Operating Income is calculated, and how it’s used in real investment situations. So —  here we go with Part 1 of 2. Click the image below.

net operating income


Part 2 is now available here.


Copyright 2021,  Frank Gallinelli and RealData® Inc. All Rights Reserved

The information presented in this article represents the opinions of the author and does not necessarily reflect the opinions of RealData® Inc. The material contained in articles that appear on realdata.com is not intended to provide legal, tax or other professional advice or to substitute for proper professional advice and/or due diligence. We urge you to consult an attorney, CPA or other appropriate professional before taking any action in regard to matters discussed in any article or posting. The posting of any article and of any link back to the author and/or the author’s company does not constitute an endorsement or recommendation of the author’s products or services.


Start Evaluating Investment Properties Today

Get Free Demo