articles
Why Real Estate Fundamentals Matter More in the Age of AI, Not Less
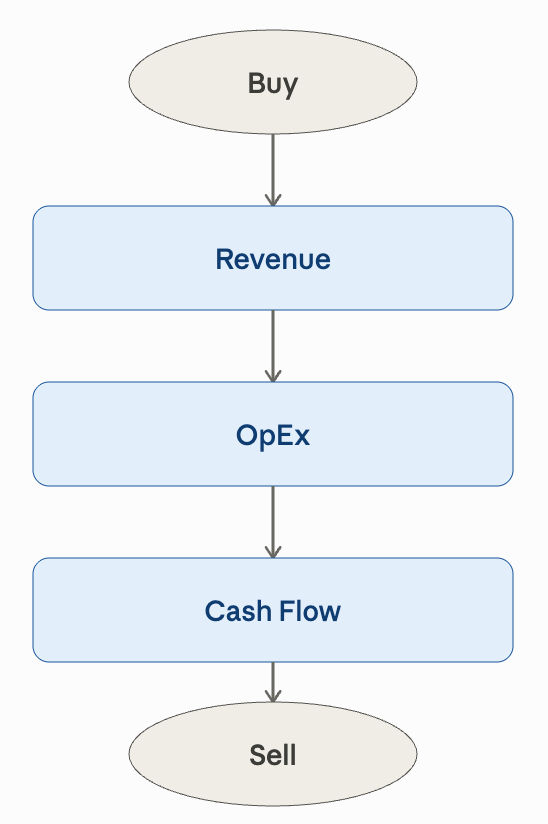
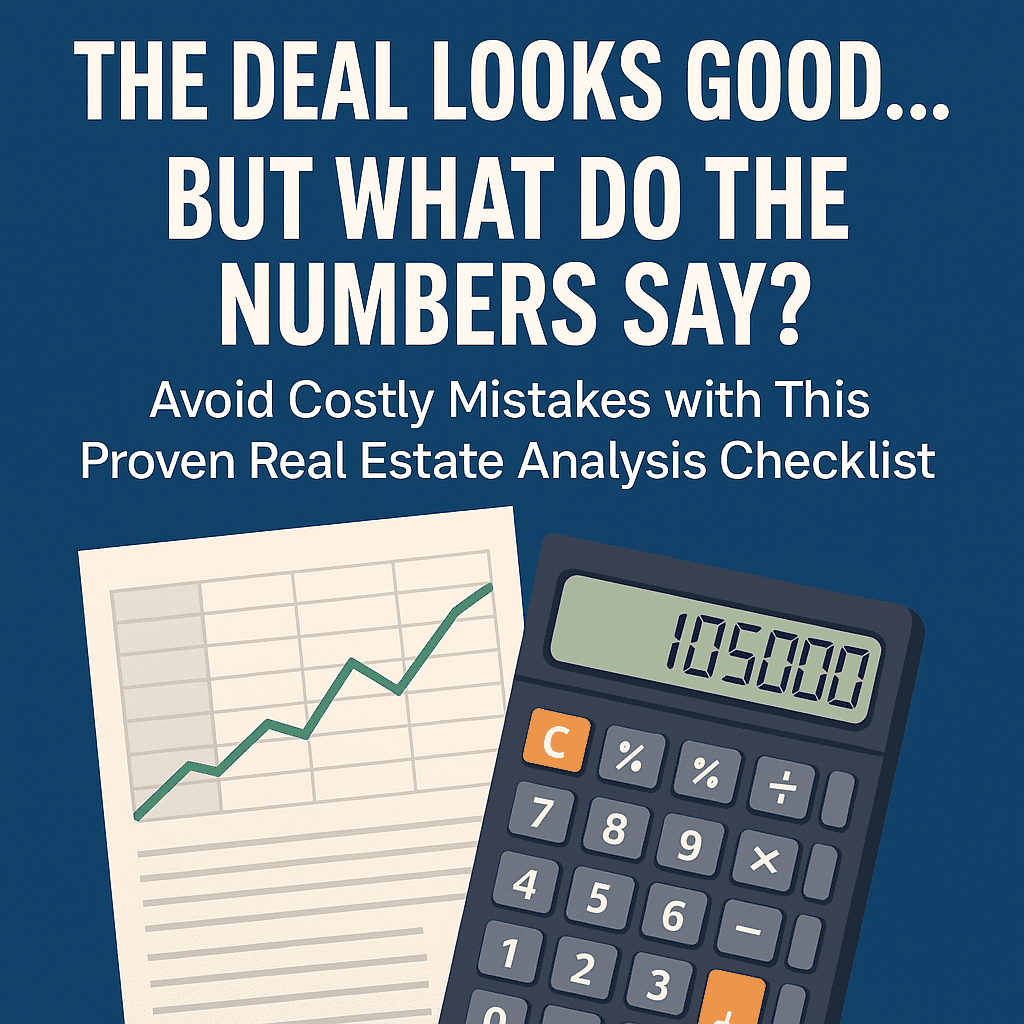
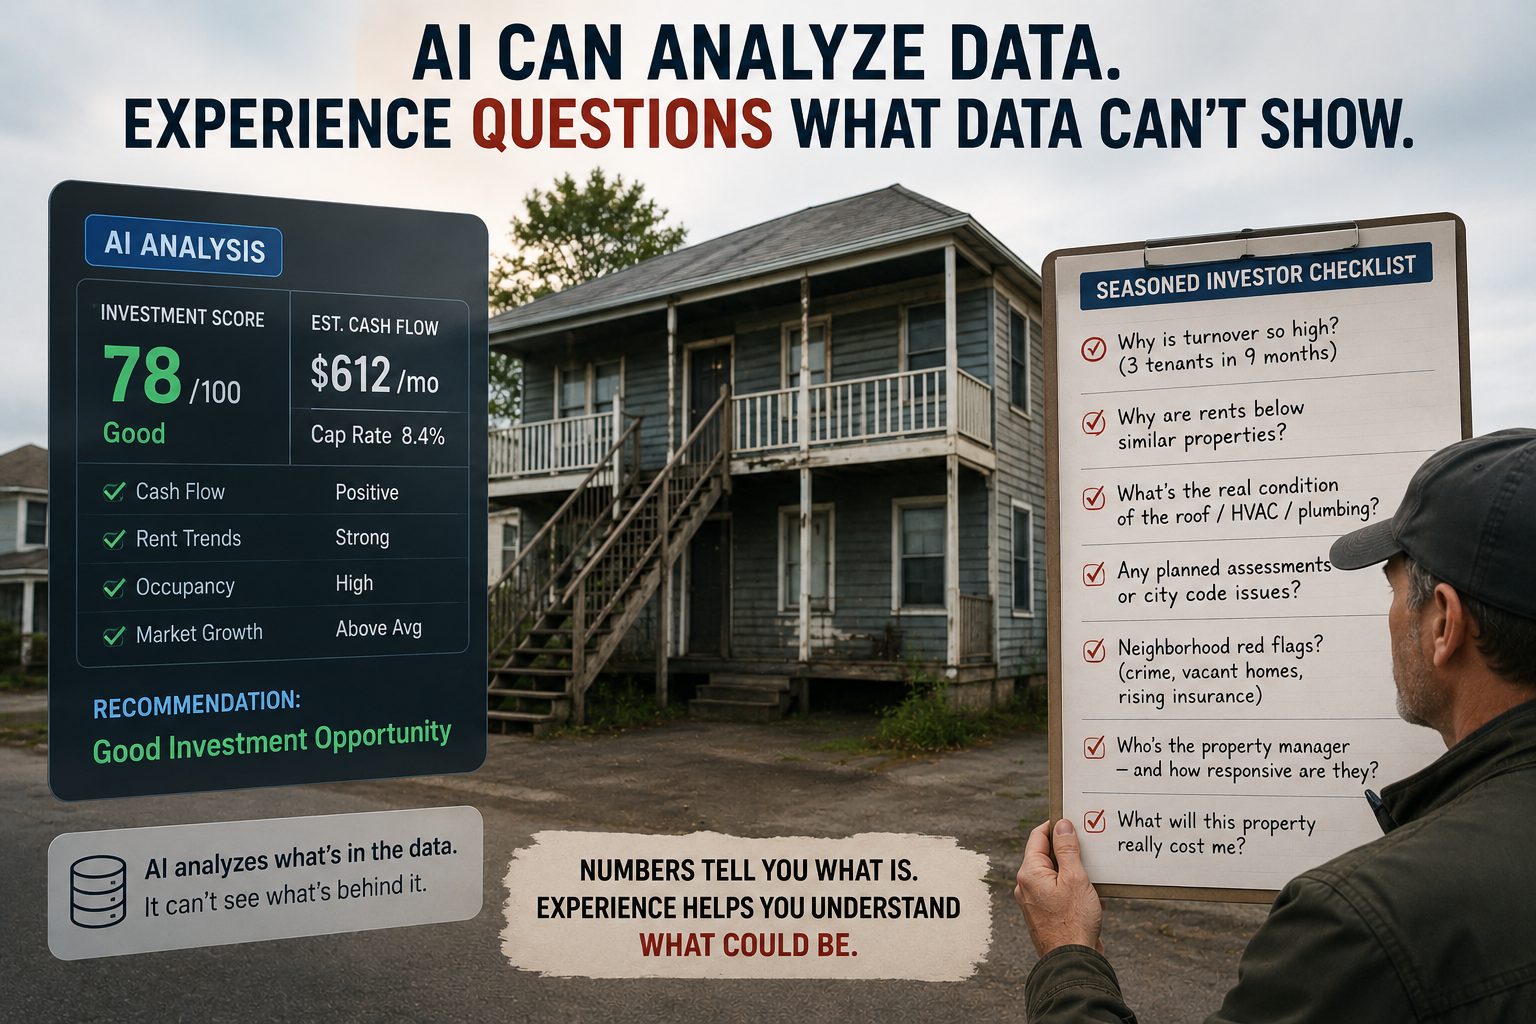
Paste a listing into an AI tool and you’ll get a slick analysis in seconds — cap rate, cash-on-cash, a confident verdict. It might also be wrong in ways that really matter. AI has changed a lot about how we analyze income property. What it hasn’t changed is who wins and who loses.
Those of you who have done a deal or two know that there is no such thing as a single correct price. Maybe a best estimate, maybe a range of possibilities, but certainly not a sure-fire right answer.
I’ll walk you through my approach, step-by-step, to zeroing in on a price that might be acceptable.